
Order for your location at https://picckisite.com/
Order Number: 970e0d55-c1f8-4c08-b95a-076cffae80d2
Order Date: 2025-08-28 03:05:11.973109
Location: Latitude: 35.8669 Longitude: -84.1957 Map
Version Number: 2025-V01
Table of Contents
Location suitability Target Market Demography Competition Amenities Real Estate Labor Market Incentives AI Assisted
Location Suitability
Farragut, Tennessee, presents a highly attractive, yet competitive, environment for a food service business due to its strong demographics, strategic location, and robust economic profile.
Here's a detailed site suitability and feasibility analysis:
Farragut, Tennessee: Site Suitability for Food Service
Overview of Farragut, TN
Farragut is an affluent and growing suburb located in Knox County, immediately west of Knoxville. It's known for its excellent schools, high quality of life, and a strong retail and service economy.
- Population: Approximately 24,000 within the town limits, but draws from a much larger surrounding area due to its commercial hubs.
- Demographics:
- Median Household Income: Significantly higher than the state and national averages (often well over $100,000). This indicates substantial disposable income for dining out.
- Education Level: Highly educated population, leading to sophisticated tastes and a willingness to explore diverse cuisines.
- Age Profile: Mix of families with children (attracted by schools) and empty-nesters/retirees. Both groups are key dining segments.
- Growth: Consistent population and economic growth over the past decades.
Key Factors for Food Service Suitability
1. Market & Demographics (Highly Favorable)
- Disposable Income: The high median household income translates directly into a strong customer base with the means to dine out frequently and spend on quality food and experiences.
- Dining Habits: An affluent, educated population often seeks out more than just basic meals. They appreciate diverse cuisines, healthy options, unique concepts, quality ingredients, and a good dining experience.
- Family Market: The presence of many families suggests demand for family-friendly restaurants, as well as takeout/delivery options for busy households.
- Professional/Business Lunch Crowd: With a strong local business presence, there's potential for a consistent lunch crowd, especially in areas near commercial offices.
2. Location & Accessibility (Crucial - Varies by Specific Site)
Farragut's primary commercial corridor is Kingston Pike (US-70/SR-1), which is the lifeblood of retail and dining in the area.
- Kingston Pike:
- Visibility & Traffic: Extremely high traffic counts, ensuring excellent visibility for businesses located along this stretch.
- Accessibility: Easy access from various parts of Farragut and the surrounding west Knoxville area. Proximity to I-40/I-75 further enhances reach.
- Retail Synergy: Surrounded by numerous shopping centers, big-box retailers, and professional offices, drawing a large volume of potential customers already in the area for other purposes.
- Parking: Ample parking is critical here, as most customers arrive by car. Sites within established shopping centers generally offer this.
- Neighborhood Centers: While Kingston Pike is dominant, there are smaller, more localized shopping centers away from the main thoroughfare that could be suitable for more community-focused concepts or those relying on a strong local following rather than drive-by traffic.
- Proximity to Turkey Creek: While technically just outside Farragut's direct boundaries (partially in Knoxville), the massive Turkey Creek shopping, dining, and entertainment district borders Farragut. This is both a massive draw and a significant competitor. Being able to capture customers moving between Farragut and Turkey Creek is key.
3. Competition Analysis (Significant - Requires Differentiation)
- High Competition: Farragut already has a very robust and diverse food service landscape. This includes:
- National Chains: A strong presence of fast-casual, casual dining, and some fine dining national brands.
- Local Favorites: Established local restaurants with strong community ties and loyal customer bases.
- Diverse Cuisines: A wide array of cuisines are already represented (Italian, Mexican, Asian, American, seafood, etc.).
- Need for Differentiation: Any new food service business must have a clear unique selling proposition (USP). This could be:
- Niche Cuisine: An underrepresented ethnic cuisine or a highly specialized concept.
- Unique Concept/Experience: A novel dining experience, theme, or interactive element.
- Superior Quality/Ingredients: Emphasis on farm-to-table, organic, or exceptionally high-quality ingredients.
- Exceptional Service: Stand-out customer service that creates loyalty.
- Specific Price Point: Filling a gap in the market (e.g., upscale casual, very affordable gourmet).
- Health-Focused: Catering to specific dietary needs (gluten-free, vegan, paleo, etc.) with a strong menu.
4. Infrastructure & Regulatory Environment (Generally Favorable)
- Utilities: Established commercial areas in Farragut have excellent access to water, sewer, natural gas, electricity, and high-speed internet.
- Zoning: The Town of Farragut has specific zoning ordinances that govern commercial development. Most commercial properties along Kingston Pike are zoned appropriately for restaurants, but specific parcel checks are essential.
- Permitting & Health Codes: Standard local and state health department regulations apply. The Town of Farragut is generally business-friendly, but strict adherence to codes and a smooth permitting process are necessary.
- Labor Pool: Access to a relatively educated and available labor pool from Farragut and surrounding areas, though competition for skilled culinary staff can be high.
5. Economic & Growth Potential (Strong)
- Consistent Growth: Farragut's population and commercial activity continue to grow, providing a continually expanding customer base.
- Resilient Economy: The area generally boasts a stable and resilient economy, which is favorable for discretionary spending on dining out.
- Support for Local Business: While competitive, there's often a strong community desire to support well-run local businesses that add value and character to the town.
Feasibility Assessment for a Food Service Business in Farragut
Strengths:
- Affluent & Educated Market: High disposable income, sophisticated palates.
- Strategic Location: High traffic counts and retail synergy on Kingston Pike.
- Growing Community: Expanding customer base.
- Good Infrastructure: Reliable utilities and a generally business-friendly environment.
- Diverse Customer Segments: Appeals to families, professionals, and retirees.
Challenges & Considerations:
- Intense Competition: Requires a strong, unique concept and excellent execution to stand out.
- High Real Estate Costs: Prime locations along Kingston Pike command premium lease rates or purchase prices.
- Market Saturation (for some concepts): Certain popular cuisines or restaurant types may already be over-represented.
- Customer Expectations: Given the competition and demographic, customers will expect high quality food, service, and atmosphere.
Overall Feasibility:
Farragut, TN, is highly feasible for starting a food service business, provided the entrepreneur carefully considers the following:
- Niche Identification: Don't just open "another" restaurant. Identify a gap in the market. Is it a specific cuisine that's missing? A unique dining experience? A particular price point that's underserved?
- Target Audience: Clearly define who your ideal customer is and tailor your concept, menu, and marketing to them.
- Strategic Site Selection: A prime location on Kingston Pike (with excellent visibility and parking) is ideal but comes at a cost. Carefully evaluate foot traffic, anchor tenants, and ease of access for any potential site.
- Robust Business Plan: A detailed plan that includes market research, competitive analysis, financial projections, marketing strategy, and operational excellence is paramount.
- Strong Differentiation: Your food, service, ambiance, or concept must be distinctive and compelling enough to draw customers away from the many existing options.
Example Opportunities:
- Upscale Casual Concept: Filling a gap between casual chains and formal fine dining, focusing on fresh, local ingredients.
- Specialty Cuisine: An authentic ethnic restaurant (e.g., specific regional Asian, Mediterranean, South American) that is currently underrepresented.
- Health-Focused Eatery: A concept centered around organic, gluten-free, vegan, or other dietary-specific options done with gourmet flair.
- Unique Dessert/Café Experience: A high-quality bakery, patisserie, or specialty coffee shop with a strong social atmosphere.
In conclusion, Farragut offers a promising landscape for a food service business due to its affluent and growing population with significant disposable income. Success, however, will hinge on a meticulously researched concept, strategic site selection, strong differentiation, and a commitment to operational excellence in a competitive market.
Target Market
Region of Influence (ROI)
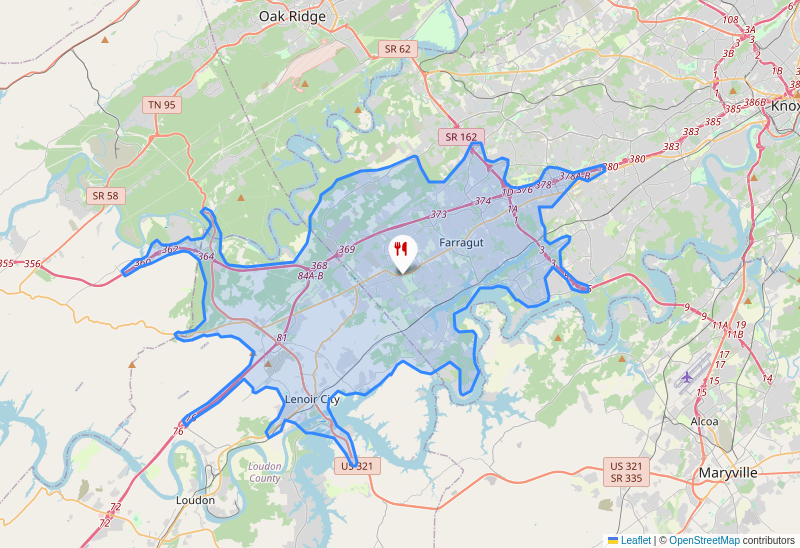
The average consumer travels about 15 minutes for casual meals, but incentives like cash back offers can motivate them to travel up to 30 minutes. PICCKI chooses a 15 minute travel distance as the Region of Influence (ROI).
The ROI represents "Equals-time" driving to your site location. This approach directly addresses key factors that influence customer patronage to your location, moving beyond simple radial distances to consider actual travel time.
Market Size
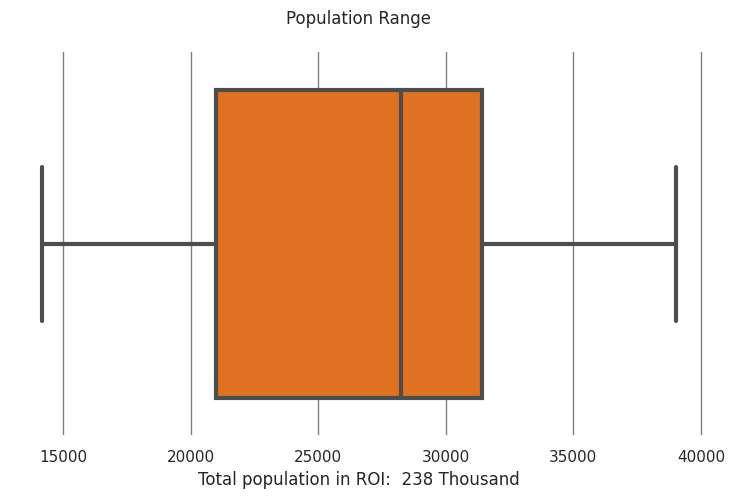
This box plot illustrates the range of total population that would have access to a potential restaurant site within its Region of Influence (ROI).
Here's a summary of the population access:
- Overall Range of Access: The population accessible to a potential restaurant site can vary significantly, ranging from approximately 14,200 people (minimum observed) to about 39,500 people (maximum observed).
- Typical Access (Middle 50%): For the majority of potential sites (the middle 50%), the population with access falls between approximately 21,000 (the 25th percentile) and 30,500 (the 75th percentile) people. This indicates the most common range of market size for a new restaurant.
- Median Access: The median population with access to a potential site is around 27,800 people. This means that half of the potential sites considered would have access to fewer than 27,800 people, and half would have access to more.
The additional information "Total population in ROI: 238 Thousand" likely refers to the sum of the populations across all the individual regions of influence that were analyzed to create this distribution, or an average figure across a broader area. While the individual sites vary in accessible population, this figure suggests a substantial overall market potential in the larger context.
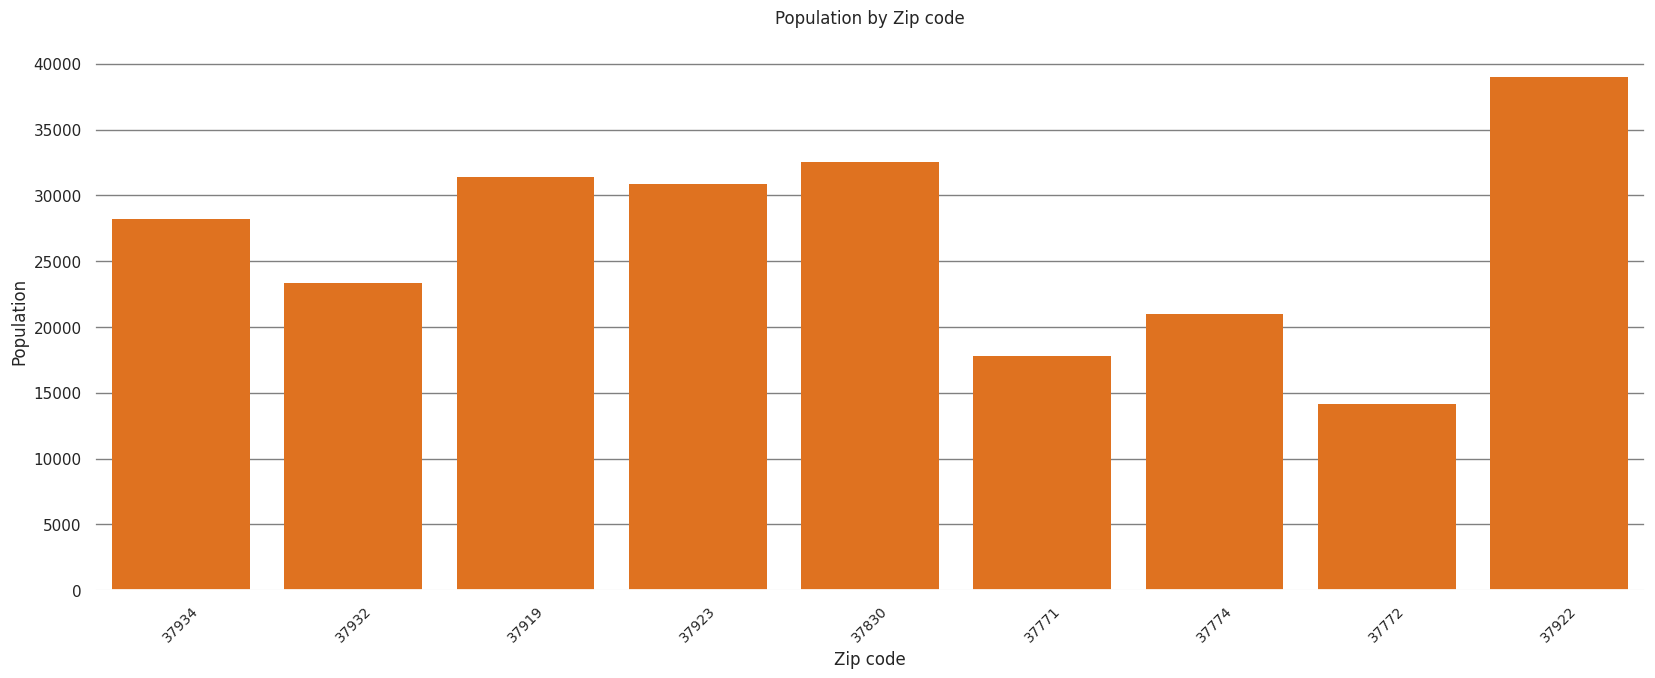
The bar chart displays the population distribution across various zip codes within the defined Region of Influence (ROI). This distribution significantly impacts the decision on site suitability for a food service business in several ways:
-
Identification of High-Potential Markets:
- Zip codes with higher populations represent a larger potential customer base. For a food service business, a greater number of residents translates directly to a higher potential for sales and revenue, assuming other factors are favorable.
- From the chart: Zip code 37922 stands out with the highest population (nearly 39,000). Other strong contenders include 37830 (approx. 32,500), 37919 (approx. 31,500), and 37923 (approx. 31,000). These areas would generally be considered more attractive for establishing a food service location due to the sheer volume of potential customers.
-
Identification of Lower-Potential/Higher-Risk Markets:
- Conversely, zip codes with significantly lower populations indicate a smaller customer pool, which can make it challenging for a food service business to achieve profitability and sustainability.
- From the chart: Zip code 37722 has the lowest population (around 14,500), followed by 37771 (around 18,000) and 37774 (around 21,000). While not entirely unsuitable, a business considering these locations would need a very strong unique selling proposition, less competition, or a very low operating cost model to succeed, as the customer base is more limited.
-
Market Viability and Scalability:
- A high population density within a zip code can support multiple food service establishments or allow a single business to scale more effectively (e.g., higher foot traffic, more delivery orders).
- The wide variance in population across these zip codes (from roughly 14,500 to 39,000) highlights that not all areas within the ROI are equally viable.
-
Target Market Alignment (with further data):
- While this chart only shows raw population, in a real-world scenario, population data would be further analyzed for demographics (age, income, household size, ethnicity, lifestyle). A zip code with a high overall population might not be suitable if its demographics don't align with the food service business's target audience (e.g., a high-end restaurant in a low-income area, or a family restaurant in an area dominated by young singles).
-
Forecasting and Business Planning:
- Population data is crucial for developing sales forecasts, understanding potential market share, and evaluating the long-term sustainability of a site. A business might set a minimum population threshold within its target radius for site selection.
In summary: The distribution of population across the ROI zip codes, as shown in the bar chart, serves as a fundamental layer in site suitability analysis for a food service business. It primarily helps identify areas with a high concentration of potential customers, which are generally preferred, while also highlighting areas that may pose greater challenges due to a smaller addressable market. However, it's crucial to combine this population data with other factors like demographics, competition, traffic patterns, accessibility, and real estate costs for a comprehensive site selection decision.
Top 5 Zip codes by Population
| Zip code | Population |
|---|---|
| 37922 | 39013 |
| 37830 | 32519 |
| 37919 | 31401 |
| 37923 | 30874 |
| 37934 | 28237 |
Demography
Languages Spoken
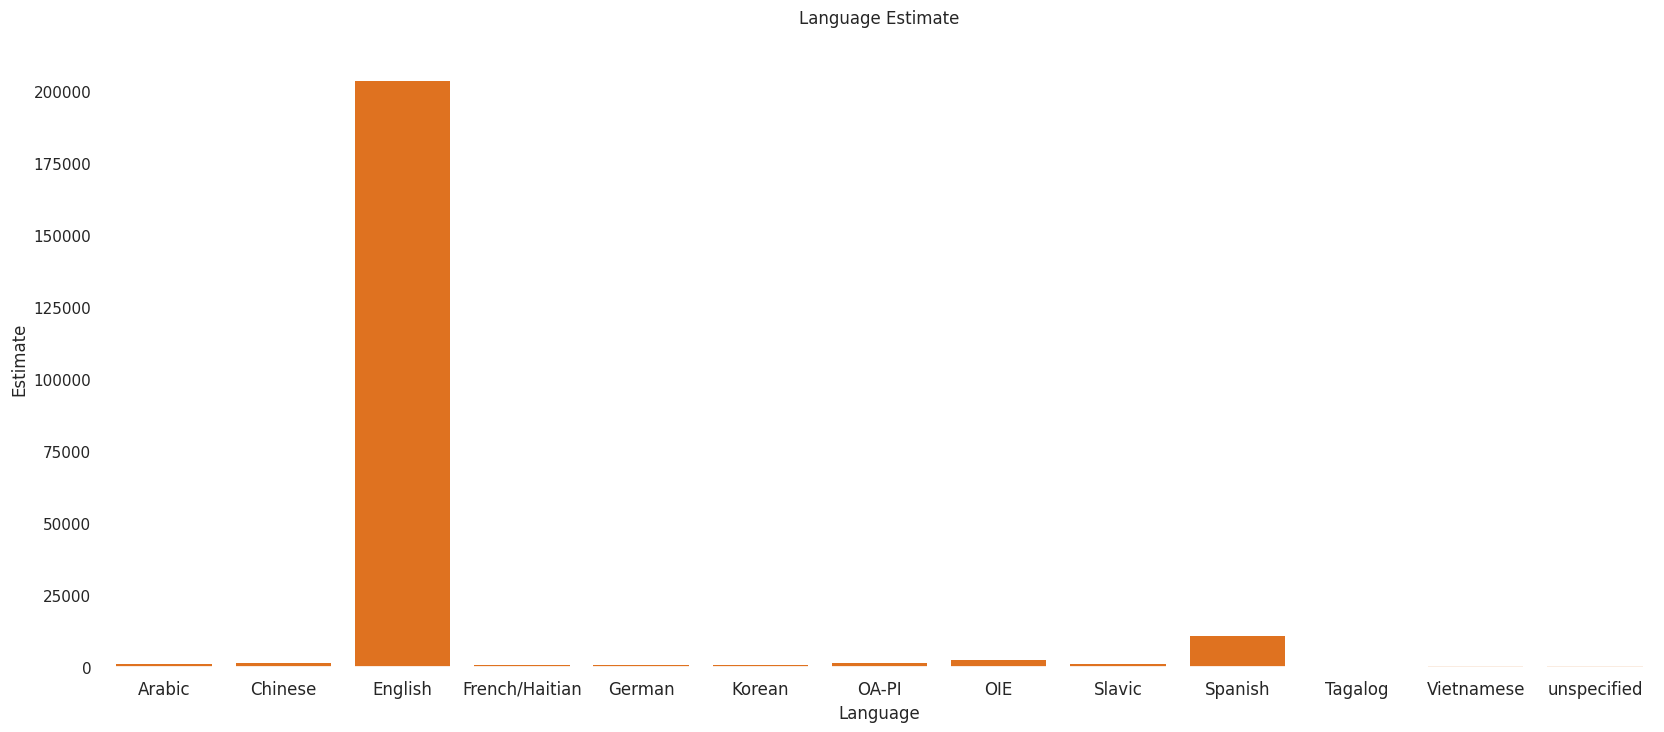
Language Spoken at Home: English: 90.3% Others: 9.7%
This bar chart, titled "Language Estimate," provides an overview of languages spoken in the ROI (Region of Influence), which can inform the potential success of various cuisine types.
Here's a summary of the data and its implications for a restaurant:
1. Overwhelming Dominance of English: * Estimate: Approximately 205,000 speakers. * Implication for Cuisine: The vast majority of the population speaks English. This means any restaurant, regardless of its specific cuisine, will need to cater effectively to an English-speaking audience. Cuisines that are broadly popular in English-speaking regions (e.g., American, Italian, general European, broadly appealing Asian fusions) would have the largest potential customer base.
2. Significant Spanish-Speaking Population: * Estimate: Approximately 11,000 speakers. * Implication for Cuisine: This is the second largest language group, representing a substantial niche market. A restaurant specializing in Mexican, Central American, or Spanish cuisine would have a clear and sizable target audience. This is a strong indicator that such a cuisine type could be viable and potentially very successful in the ROI, especially if it also appeals to the broader English-speaking market.
3. Minor Language Groups (Small Niche Markets): * Estimates: * Arabic: ~1,500 speakers * Chinese: ~1,500 speakers * French/Haitian: ~1,500 speakers * German, Korean, OA-PI (Other Asian/Pacific Islander), OIE (Other Indo-European), Slavic: Each group is estimated to be very small, likely in the range of 500-1,000 speakers. * Implication for Cuisine: Restaurants specializing in cuisines corresponding to these languages (e.g., Middle Eastern, various Chinese regional cuisines, French/Haitian, German, Korean, various Eastern European) would be targeting a very small, niche market. While these cuisines could work, their success would heavily depend on: * Attracting a significant portion of the English-speaking population interested in diverse foods. * Being located in a highly concentrated area where these specific language speakers reside. * Offering a unique or high-quality experience that draws customers from further afield. * Low operating costs or a high-margin business model to sustain a smaller customer base.
4. Negligible Language Groups: * Estimates: Tagalog, Vietnamese, and Unspecified show extremely low or no discernible speaker estimates on the chart. * Implication for Cuisine: Opening a restaurant specifically targeting Filipino (Tagalog) or Vietnamese cuisine would likely face significant challenges based solely on the local language-speaking population in this ROI. Such ventures would almost entirely rely on attracting customers from the broader English-speaking population who are adventurous or familiar with these cuisines.
Conclusion for Restaurant Potential:
- Most Promising: A restaurant serving Spanish/Mexican/Central American cuisine has a strong foundation with the second-largest language group and could also appeal to the dominant English-speaking population.
- Broadest Appeal: Any restaurant offering general American or widely popular international cuisines (e.g., Italian, general Asian fusion, popular European dishes) would tap into the largest segment of the population.
- Niche, but Possible with Strategy: Cuisines like Middle Eastern, Chinese, Korean, or French/Haitian have a small dedicated audience. Success would require a strong appeal to the general English-speaking public or a very specific strategy for reaching and serving these small communities effectively.
- Least Promising based on Language Data: Highly specific cuisines like Filipino or Vietnamese would be very difficult to sustain solely on the local language-speaking population in this ROI.
Ultimately, while the ROI is primarily English-speaking, the significant Spanish-speaking population presents a clear opportunity for related cuisine types. Other niche cuisines would require careful market analysis and a broader appeal strategy.
Income
Range Median Income of Area Covered: $62,338 to $135,472
Tennessee State Median Income : $67,097
This income data provides a robust foundation for a new food service business, but the key is understanding the range within the "area covered." Here's a summary of how someone can use this information to inform their strategy:
Overall Takeaway: The "area covered" is significantly more affluent than the Tennessee state average, indicating a strong market with higher disposable income for dining out. However, the wide range means careful segmentation is crucial.
Key Insights & Implications:
-
High Average Disposable Income:
- Area Average Median Income ($91,771) is 37% higher than the Tennessee State Median Income ($67,097). This suggests that residents in this area generally have more money to spend on non-essential items, including dining out, premium food experiences, and convenience.
- Implication: The business can likely command higher prices and focus on quality, experience, and unique offerings rather than solely competing on price.
-
Significant Income Disparity Within the Area:
- The Range Median Income ($62,338 to $135,472) is the most critical piece of information. It indicates that "the area covered" is not homogeneous. There are pockets of lower-income households (close to the state average) and very high-income households (double the state average).
- Implication: A "one-size-fits-all" approach will likely fail. The business needs to strategically target a specific segment within this range, or develop a multi-tiered offering if the location allows for distinct customer flows.
Actionable Strategies for a New Food Service Business:
-
Target Audience & Concept Development:
- High-End Focus (targeting $100K+ segment): Consider a concept that caters to the affluent:
- Fine Dining/Upscale Casual: Premium ingredients (local, organic, exotic), sophisticated menu, excellent service, unique ambiance, chef-driven concept, craft cocktails/wine list.
- Specialty Cuisine: Ethnic cuisines not widely available (e.g., authentic regional Italian, elevated Asian fusion, modern American with a twist).
- Experiential Dining: Tasting menus, interactive elements, themed dinners.
- Pricing: Justify higher price points through quality and experience.
- Mid-to-Upper Tier Focus (targeting $70K-$100K segment): This aligns with the average and slightly above.
- High-Quality Casual: Upscale comfort food, elevated diner, fast-casual with gourmet ingredients, consistent quality and good value.
- Family-Friendly (but not cheap): Quality ingredients, comfortable atmosphere, options for all ages, potentially with a slightly higher price point than typical family restaurants.
- Pricing: Good value for money, but still allowing for profit margins on quality ingredients.
- Value-Oriented Focus (targeting $60K-$70K segment): While the average is high, this segment exists.
- Quality & Affordability: Focus on well-prepared, consistent food at a competitive price point. Think excellent pizza, sandwiches, tacos, or comfort food with a strong local following.
- Speed/Convenience: Often valued by all income levels, but critical for value-oriented segments.
- Pricing: Must be very competitive within this segment, but still aim for slightly better quality than typical fast food.
- High-End Focus (targeting $100K+ segment): Consider a concept that caters to the affluent:
-
Location Selection (Crucial for the Range):
- Drill Down: Don't just pick a spot in the "area covered." Research specific neighborhoods, traffic patterns, and existing businesses. Are you locating near the $135K households or the $62K households?
- Visibility & Accessibility: Ensure the location aligns with your chosen target audience's habits (e.g., downtown for professionals, suburban hub for families, shopping district for shoppers).
-
Pricing Strategy:
- Leverage Higher Average: The higher average median income means you have more flexibility to set higher prices than if you were operating in a state-average income area.
- Value Perception: Regardless of price point, customers in this area will likely expect high value for their money, whether it's through exceptional quality, unique experience, or efficient service.
-
Menu Development:
- Ingredient Sourcing: Higher income brackets often value sustainable, local, organic, and ethically sourced ingredients. Highlight these on your menu if you choose an upscale concept.
- Dietary Needs: Consider offering options for various dietary restrictions (vegetarian, vegan, gluten-free), which are often more prevalent among higher-income, health-conscious demographics.
- Beverage Program: A strong beverage program (craft beers, curated wine list, signature cocktails, specialty non-alcoholic options) can significantly boost revenue and appeal to a more affluent clientele.
-
Marketing & Branding:
- Tailor Messaging:
- High-End: Emphasize quality, exclusivity, experience, and chef's vision.
- Mid-Tier: Focus on comfort, consistency, community, and "great food, good price."
- Value: Highlight affordability, speed, and family-friendliness.
- Digital Presence: A professional website, strong social media presence (showcasing food and ambiance), and online ordering/reservations are essential across all segments.
- Local Partnerships: Collaborate with other local businesses that cater to your target demographic.
- Tailor Messaging:
-
Service & Ambiance:
- Higher income often correlates with higher expectations for service. Invest in well-trained, professional staff.
- The ambiance (decor, lighting, music) should match the price point and target audience. For higher income, a comfortable, stylish, and clean environment is paramount.
Conclusion:
This data paints a promising picture for a new food service business in this "area covered," primarily due to the significantly higher average income compared to the state. However, the wide income range demands a strategic decision: who specifically are you trying to serve within this area? By carefully defining your target demographic (based on their income level within the given range) and tailoring your concept, pricing, location, and marketing accordingly, the business can significantly increase its chances of success. Ignoring the income disparity and aiming for a broad appeal without a clear strategy would be a missed opportunity.
Job Opportunity
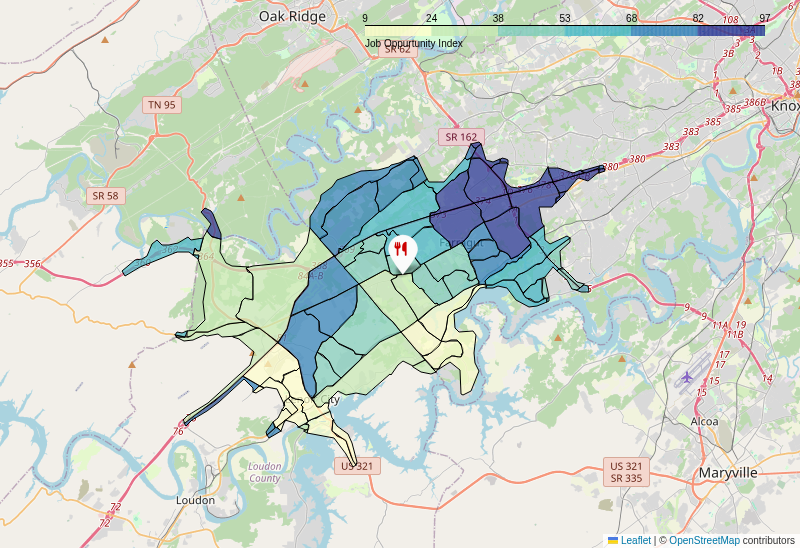
Higher Customer Base: Areas with a high concentration of job opportunities likely have a larger daytime population due to employees working in those areas. This translates to a larger potential customer base for restaurants, especially during lunch hours and after work.
Increased Spending Power: Areas with more businesses and jobs often have a higher concentration of people with disposable income, leading to more frequent dining out and potentially higher average spending per customer.
Business Catering and Events: Businesses located in high job opportunity areas may generate demand for catering services for meetings, events, and corporate lunches, providing an additional revenue stream for restaurants.
📉 Negative Impacts (Areas with Low Job Opportunity Index - Greener Areas):Lower Customer Base: Areas with fewer job opportunities typically have a smaller daytime population, leading to a reduced potential customer base, especially during weekdays.
Reliance on Local Residents: Restaurants in these areas may be more reliant on the local residential population, which might have different dining habits and spending patterns compared to a business-heavy area.
🎯 Strategic Considerations:Location Decisions: For new restaurants, the Job Opportunity Index can be a crucial factor in site selection. Areas with a high index might offer greater revenue potential, although competition could also be higher.
Marketing Strategies: Restaurants in high job opportunity areas might tailor their marketing towards the working population (e.g., lunch specials, happy hour). Restaurants in lower index areas might focus more on local residents and weekend crowds.
Competition
Price Levels
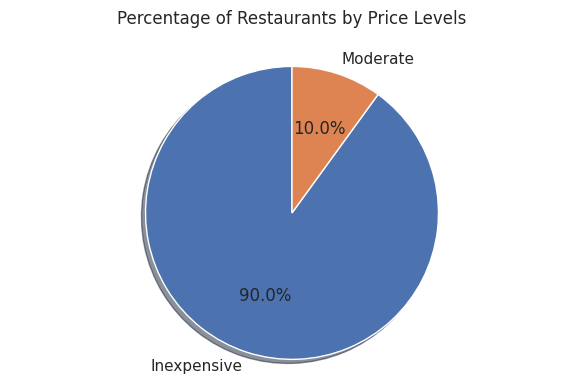
Price Level Categories:
- Free: Free or low-cost food programs
- $ (Inexpensive): Typically $10 and under per person
- $$ (Moderate): Generally $11-$30 per person
- $$$ (Expensive): Usually $31-$60 range
- $$$$ (Very Expensive): Generally $60+
Based on the pie chart provided:
Summary of the Restaurant Market by Price Level
The pie chart titled "Percentage of Restaurants by Price Levels" illustrates the current distribution of restaurant pricing at this specific location. It clearly shows a market heavily dominated by "Inexpensive" dining options.
- Inexpensive Restaurants: Account for a vast 90.0% of all restaurants.
- Moderate Restaurants: Make up a small minority, at just 10.0% of all restaurants.
Notably, there are no categories shown for "Expensive" or "Fine Dining" establishments, suggesting they either do not exist in this location or constitute a negligible percentage not captured in these two categories.
Guidance for Starting a New Restaurant at This Location
This data provides critical insights for a potential new restaurant owner:
-
High Competition in the "Inexpensive" Segment (90%):
- Implication: This segment is highly saturated. If you plan to open an "Inexpensive" restaurant, you will face immense competition.
- Guidance: To succeed, your "Inexpensive" restaurant must have a strong differentiating factor. This could be:
- Unique Cuisine: Offer something not readily available (e.g., a specific ethnic food, a niche dietary option).
- Exceptional Value: Provide significantly higher quality food or experience for the price point.
- Operational Efficiency: Focus on speed, convenience, or a highly optimized business model (e.g., food truck, grab-and-go).
- Strong Brand/Concept: Create a compelling story or atmosphere that attracts customers despite the low price.
-
Potential Opportunity in the "Moderate" Segment (10%):
- Implication: This segment has significantly less competition. It suggests there might be an unmet demand for options that are a step up from "Inexpensive" without being too pricey.
- Guidance: Consider opening a "Moderate" restaurant. This could appeal to customers who:
- Are willing to pay a little more for better quality ingredients, a more comfortable dining experience, or superior service.
- Are looking for a slightly more upscale option for casual dining, business lunches, or family dinners.
- Crucial Step: Before committing, conduct further market research to understand why there are so few moderate options. Is it truly unmet demand, or is the local demographic simply unwilling to spend beyond "Inexpensive"? Talk to existing moderate restaurant owners if possible, or survey potential customers.
-
Untapped Potential (and Risk) in "Expensive" or "Fine Dining" (0% shown):
- Implication: The chart doesn't show any restaurants in higher price tiers. This could mean either a complete lack of demand or a significant gap in the market.
- Guidance: While there's no direct competition, this is the riskiest venture. You would need to thoroughly research:
- Local Demographics & Income Levels: Can the local population (or tourists/visitors) afford and are they willing to pay for expensive dining?
- Lifestyle & Occasions: Are there specific occasions (celebrations, business meetings) that would drive demand for higher-end restaurants?
- Accessibility to Other Areas: Do people travel to nearby locations for fine dining, indicating a desire that could be met locally?
- If strong demand is identified, this could be a highly profitable niche with no direct local competitors.
Overall Recommendation:
The most prudent approach would likely involve exploring the "Moderate" segment. It offers a balance between potentially lower competition and a likely broader appeal than fine dining in a market dominated by inexpensive options. However, for any category, in-depth market research beyond just price levels is absolutely essential. Understand the local customer preferences, foot traffic, local economy, and specific cuisine gaps before making a final decision.
Competition Ratings
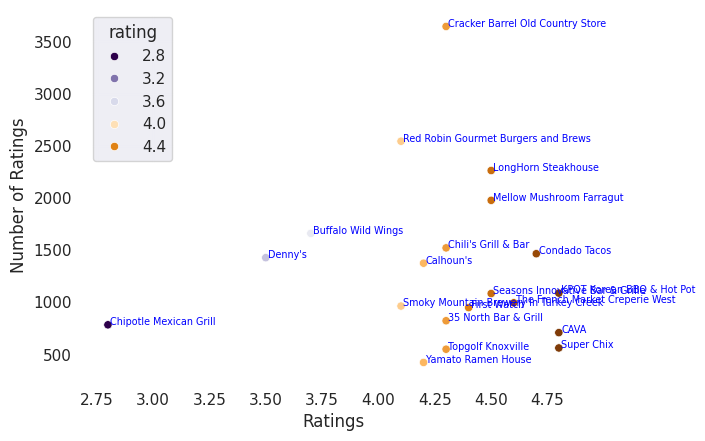
This chart is a scatterplot illustrating the performance of various restaurants in a Region of Influence (ROI), based on their average customer ratings and the total number of ratings received. Each point represents a restaurant, labeled with its name.
Summary of the Chart:
- Overall Rating Distribution: The majority of restaurants in the ROI are highly rated, with a significant cluster falling between 4.2 and 4.75 stars. This suggests a competitive market where customers generally expect and receive good to excellent service and food quality.
- Number of Ratings (Volume): The volume of ratings varies widely, from less than 500 to over 3700.
- High Volume, High Rating: Cracker Barrel Old Country Store stands out with the highest number of ratings (approximately 3600) and an excellent average rating (around 4.6). Red Robin Gourmet Burgers and Brews also performs strongly with a high volume of ratings (approx. 2600) and a good rating (approx. 4.4). LongHorn Steakhouse and Mellow Mushroom Farragut also show a good balance of high ratings and substantial review numbers.
- Moderate Volume, High Rating: Several restaurants, such as Condado Tacos, CAVA, Super Chix, and others in the 4.5-4.75 range, have a moderate number of ratings (typically between 500 and 1500), indicating strong customer satisfaction even with fewer overall reviews compared to the top volume leaders.
- Lower Rated Restaurants: A few establishments have lower average ratings:
- Chipotle Mexican Grill has the lowest rating (around 2.8 stars) with a moderate number of reviews (approx. 800).
- Denny's is rated around 3.5 stars with approximately 1400 ratings.
- Buffalo Wild Wings has a rating of about 3.8 stars with approximately 1600 ratings.
- Relationship Between Ratings and Volume: There isn't a direct linear correlation where more ratings automatically mean a higher average rating, or vice versa. While top performers like Cracker Barrel and Red Robin show both high ratings and high volume, many other highly-rated restaurants have fewer reviews. Conversely, established chains like Denny's and Buffalo Wild Wings maintain a decent volume of ratings despite having average ratings below 4.0.
Information Source for Starting a New Restaurant in this ROI (Customer Service Targets based on "Price Point"):
Assuming "price point for customer service" refers to the level of customer service and the quality of experience a restaurant aims to provide, which then translates into expected customer ratings:
To succeed in this ROI, a new restaurant should aim for a high level of customer service, as the market is clearly competitive with many well-regarded establishments.
-
For a "Premium" or "Excellent" Customer Service Target (High Price Point/Value):
- Rating Target: Aim for 4.5 stars and above. This is where many of the highly-regarded restaurants like Condado Tacos, CAVA, Super Chix, LongHorn Steakhouse, Mellow Mushroom Farragut, and Cracker Barrel operate.
- Implication: To achieve this, your customer service must be consistently outstanding, exceeding expectations in terms of food quality, service attentiveness, ambiance, and overall experience. Even a moderate number of initial ratings (say, 500-1500) at this level will quickly establish your reputation as a top-tier choice. This segment seems to value quality over sheer volume of reviews, indicating that a strong initial impression matters significantly.
-
For a "Good" or "Reliable" Customer Service Target (Mid-Range Price Point/Value):
- Rating Target: Aim for 4.0 to 4.4 stars. Restaurants like Red Robin, Chili's Grill & Bar, Calhoun's, and Smoky Mountain Brewery fall into this category.
- Implication: This range signifies solid performance and customer satisfaction. While still competitive, achieving this level means providing a consistent, enjoyable dining experience without necessarily needing to be "luxury." To stand out in this range, a new restaurant would need to differentiate through unique cuisine, atmosphere, or specific value propositions, as there are many established brands already here with a significant number of loyal customers.
-
For "Average" or "Budget-Friendly" Customer Service Target (Lower Price Point/Value):
- Rating Target: Avoid falling below 4.0 stars, especially as a new entrant.
- Implication: Restaurants like Chipotle Mexican Grill, Denny's, and Buffalo Wild Wings, which have ratings below 4.0, are typically established chains that rely on brand recognition, specific niches, or very high volume. A new restaurant attempting to compete in this lower-rated segment without an existing brand or a highly unique, low-cost offering would face significant challenges in attracting and retaining customers in an ROI where the general expectation for ratings is much higher.
Key Takeaways for a New Restaurant:
- Aim High: The market in this ROI has a high baseline expectation for restaurant quality. Target a minimum of 4.0 stars, but ideally 4.25-4.50+ from day one.
- Consistency is Crucial: To build a good average rating, especially in the initial stages, consistent excellent customer service and food quality are paramount. Early positive reviews will set the tone.
- Understand Your Niche: If targeting a "premium" service level, focus relentlessly on every detail. If aiming for "good/reliable," ensure your unique selling proposition (e.g., specific cuisine, ambiance, speed) is strong enough to compete with established players in the 4.0-4.4 range.
- Monitor Competitors: Pay attention to what the top-rated restaurants are doing well and what areas the lower-rated ones are struggling with to inform your strategy.
Popular restaurants near the site, sorted by count of user ratings
| Name | Rating | Count |
|---|---|---|
| Cracker Barrel Old Country Store | 4.30 | 3644 |
| Red Robin Gourmet Burgers and Brews | 4.10 | 2543 |
| LongHorn Steakhouse | 4.50 | 2262 |
| Mellow Mushroom Farragut | 4.50 | 1976 |
| Buffalo Wild Wings | 3.70 | 1659 |
| Chili's Grill & Bar | 4.30 | 1520 |
| Condado Tacos | 4.70 | 1464 |
| Denny's | 3.50 | 1426 |
| Calhoun's | 4.20 | 1373 |
| KPOT Korean BBQ & Hot Pot | 4.80 | 1086 |
Competition Proximity
🔵 Blue - Restaurants | 🟠 Orange - Fast Food
Only businesses within a 3 mile radial distance from site are plotted
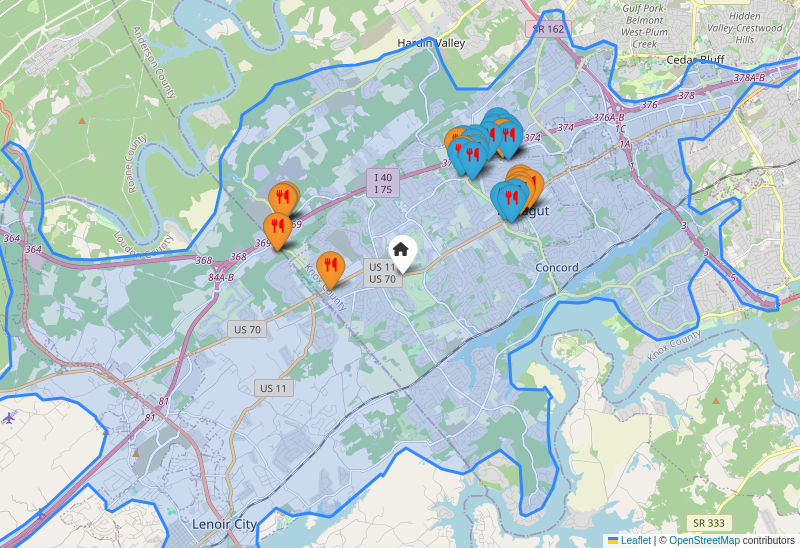
This map illustrates the existing restaurant landscape for a new food service location (marked by the home icon) at the intersection of US 11 and US 70. Orange icons denote Fast Food establishments, while Blue icons represent full-service Restaurants.
Here's an interpretation of the competitive environment and guidance for the new restaurateur:
Competitive Landscape Analysis:
- High Saturation to the North (Farragut/I-40/I-75 Corridor): The most significant concentration of both Fast Food (orange) and Restaurants (blue) is located to the north of your proposed site, particularly around the "Farragut" area along the I-40 and I-75 interstate highways. This area appears to be a major commercial hub, attracting customers from a wider radius and commuters. Any new establishment here would face intense, direct competition across various dining categories.
- Existing Fast Food to the West: To the immediate west of your location, along US 70, there are a few established Fast Food (orange) outlets. If your new venture is also fast food, you will have direct competitors within a short driving distance.
- Sparse Immediate Competition for Full-Service: While there are fast food options nearby, the immediate vicinity of your proposed location at the US 11/US 70 intersection appears to have fewer visible full-service (blue) restaurant competitors compared to the northern cluster. This could present a potential niche.
- Strategic Location on Arterial Roads: Your proposed location sits at the intersection of two major US routes (US 11 and US 70), indicating good visibility and potential for capturing traffic from local residents and those commuting through the area.
Guidance for the New Restaurateur:
Given this competitive environment, here's how to strategize:
-
Identify Your Niche and Differentiate:
- Avoid Direct Duplication: Do not aim to be just another fast-food joint if there are already several similar ones nearby. Similarly, if your plan is a full-service restaurant, ensure your cuisine, ambiance, or price point stands out from the many options in the northern hub.
- Unique Offering: Consider offering a cuisine type, dining experience (e.g., fine dining, family-friendly, quick-casual with a twist), or specific dietary focus (e.g., vegan, gluten-free, local farm-to-table) that is currently underserved in the immediate vicinity or provides a compelling alternative to the larger northern cluster.
-
Target Your Market Strategically:
- Local Community Focus: Your location on US 11/US 70 is well-positioned to serve the immediate local residential and business communities who might prefer not to drive to the more congested I-40/I-75 corridor for their meals. Focus marketing efforts on building a strong local customer base.
- Commuter Appeal: Leverage the heavy traffic on US 11 and US 70. Design your establishment for easy access, quick service (if applicable), and clear signage to attract commuters looking for a convenient stop.
-
Assess Your Business Model Against Competition:
- If Fast Food: You must compete on speed, value, quality, or a unique menu item to draw customers away from the existing orange icons to your west and the vast options to the north.
- If Full-Service Restaurant: While there are fewer direct visible blue icons immediately around you, the broader area has many. Your advantage lies in convenience for the immediate locale and offering a compelling reason for customers to choose you over driving to the more established (but possibly busier) restaurants in Farragut.
-
Leverage Location for Visibility and Accessibility:
- Ensure your building has excellent visibility from both US 11 and US 70.
- Design for easy and safe entry/exit for vehicles to maximize convenience for passing traffic.
In summary, your proposed location is strategically placed on significant roadways but is situated between existing fast-food options to the west and a dense, diverse restaurant hub to the north. Success will depend heavily on a well-defined concept, strong differentiation, and effectively appealing to the immediate local market and commuter traffic.
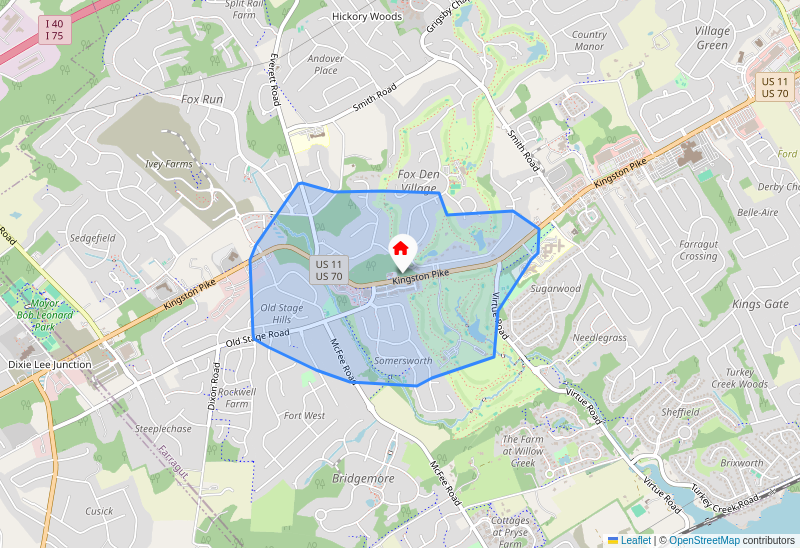
🍔 Fast Food within 15 minutes walking distance from the site
🍽️ Restaurants within 15 minutes walking distance from the site
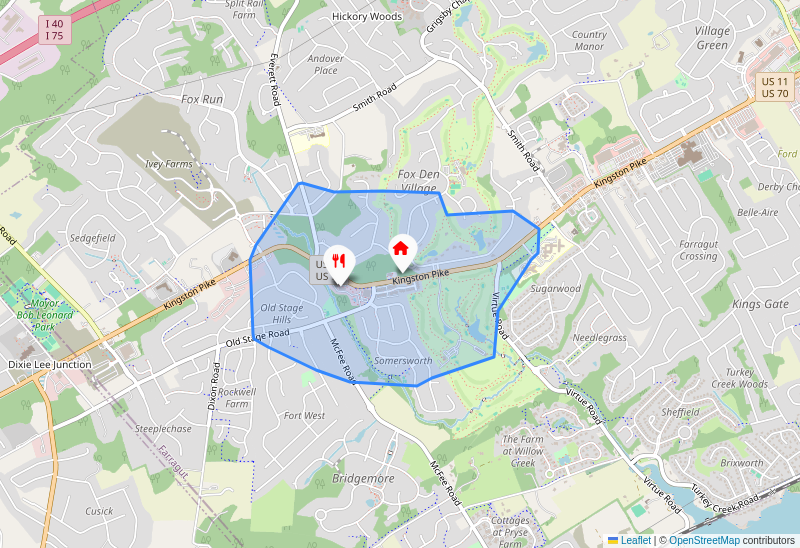
Fast Food near Site: 0
Restaurants near Site: 2

Restaurants near Site: 2
What's Nearby
🟢 Green - Hotels/Motels | 🔵 Blue - Community/Convention center/Apartments | 🟠 Orange - Educational Institution
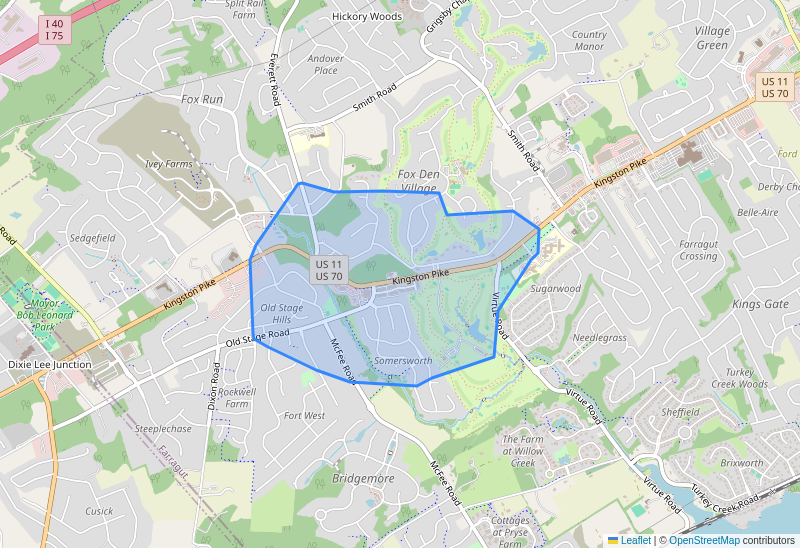
Universities/Colleges : 0
Hotels/Motels: 0
Community/Convention center/Apartments: 0
Amenities
Accessibility


Travel Times (approximately 5 miles in each direction)
| Time (minutes) | Direction | Flow |
|---|---|---|
| 16 | North | From-Site |
| 14 | South | From-Site |
| 11 | East | From-Site |
| 10 | West | From-Site |
| 17 | North | To-Site |
| 15 | South | To-Site |
| 11 | East | To-Site |
| 10 | West | To-Site |
This bar chart illustrates the estimated travel times in minutes for a 5-mile distance to and from a potential restaurant site across four different directions: West, East, South, and North.
Here's a summary of the chart:
- Fastest Travel Times: The West direction shows the quickest travel times, consistently at 10 minutes both to and from the site. This translates to an average speed of 30 mph (5 miles / (10/60 hours)).
- Second Fastest: The East direction is slightly slower but still efficient, with 11 minutes of travel time in both directions (approx. 27.3 mph).
- Slower Travel Times: The South direction takes 14 minutes to travel from the site and 15 minutes to travel to the site (approx. 20-21 mph).
- Slowest Travel Times: The North direction exhibits the longest travel times, with 16 minutes from the site and 17 minutes to the site (approx. 17.6-18.7 mph).
- Directional Asymmetry: For the South and North directions, the time to travel to the site is slightly longer than the time to travel from the site. This could indicate specific traffic patterns, rush hour impacts, or road configurations that make arriving at the site from these directions slightly more time-consuming.
Impact on Accessibility to the Restaurant:
The varying travel times significantly impact the perceived accessibility of the restaurant:
-
High Accessibility (West & East): Customers living 5 miles to the West or East of the site will find the restaurant highly accessible. A 10-11 minute drive for 5 miles is relatively quick and convenient, making it attractive for regular visits, spontaneous dining, and potentially takeout/delivery orders. These areas represent the primary "convenience zone."
-
Moderate Accessibility (South): The South direction presents a moderate level of accessibility. A 14-15 minute drive for 5 miles is not excessively long but could be perceived as more of a "commute" than a quick trip. Customers from this direction might be less inclined for frequent, spontaneous visits, and may require a stronger incentive or a planned outing. The slightly longer "to-site" time suggests potential inbound traffic challenges.
-
Lower Accessibility (North): The North direction has the lowest accessibility. A 16-17 minute drive for only 5 miles is quite slow (averaging under 20 mph), suggesting significant traffic congestion, a less direct route, or multiple stops/lights. Customers from the North might perceive the restaurant as "far" or "a hassle to get to," even though the distance is the same as other directions. This could deter casual visits and limit the frequency of patronage from this segment, making it more of a destination for special occasions.
Strategies to Target Customer Base:
Based on this information, a restaurant can tailor its strategies:
-
Focus on "Convenience Zones" (West & East):
- Hyper-local Marketing: Distribute flyers, run social media ads, and partner with local businesses/community groups specifically targeting neighborhoods in the West and East.
- Loyalty Programs: Implement loyalty programs to encourage repeat business from these easily accessible customers.
- Takeout/Delivery: Emphasize efficient takeout and delivery services, promoting quicker pick-up/delivery times for these directions.
- Everyday Dining: Position the restaurant as a convenient, go-to spot for daily meals or quick meetups.
-
Attract "Consideration Zones" (South):
- Value-Add Promotions: Offer compelling reasons to make the slightly longer trip, such as happy hour specials, family meal deals, or themed nights (e.g., trivia, live music).
- Digital Presence & Reviews: Ensure a strong online presence with excellent reviews, high-quality photos, and clear menu descriptions to convince customers the trip is worthwhile.
- Traffic-Aware Messaging: If the "to-site" time indicates rush hour, perhaps promote off-peak dining hours with special offers to encourage visits when traffic is lighter.
-
Incentivize "Destination Zones" (North):
- "Worth the Drive" Positioning: Market the restaurant as a unique dining experience, perfect for special occasions, celebrations, or a culinary adventure. Focus on unique dishes, ambiance, or chef reputation.
- Event-Based Marketing: Host special events, tasting menus, or cooking classes that act as a destination, making the longer travel time less of a deterrent.
- Group Reservations: Target group bookings from offices or organizations in the North, as groups are often more willing to travel for a specific event.
- Clear Directions & Parking: Provide exceptionally clear directions and ample, easy-to-access parking information to reduce frustration for customers traveling from this direction.
- Strategic Delivery: If offering delivery to the North, ensure the delivery radius and fees are adjusted to account for longer travel times, or partner with third-party services that can manage this efficiently.
-
General Strategies:
- Time-Aware Promotions: Consider "beat the clock" or "early bird" specials that encourage dining during times when traffic is generally lighter in all directions.
- Route Optimization on Website: Embed a mapping tool on the restaurant's website that shows estimated travel times from various points, acknowledging the directional differences.
- Feedback & Observation: Monitor customer feedback regarding travel times and observe actual traffic patterns to fine-tune these strategies over time.
By understanding these travel time dynamics, the restaurant can strategically allocate marketing resources and tailor its offerings to maximize its appeal across all potential customer segments.
Real Estate
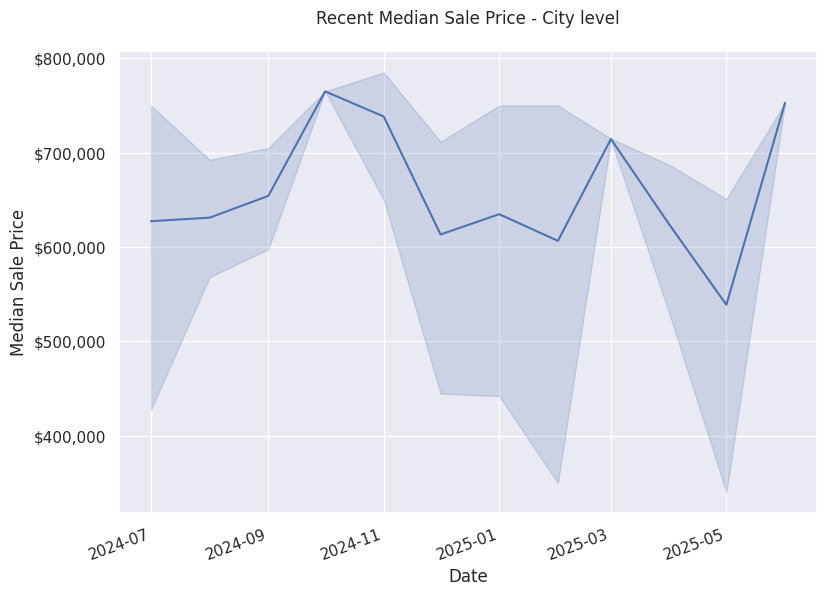
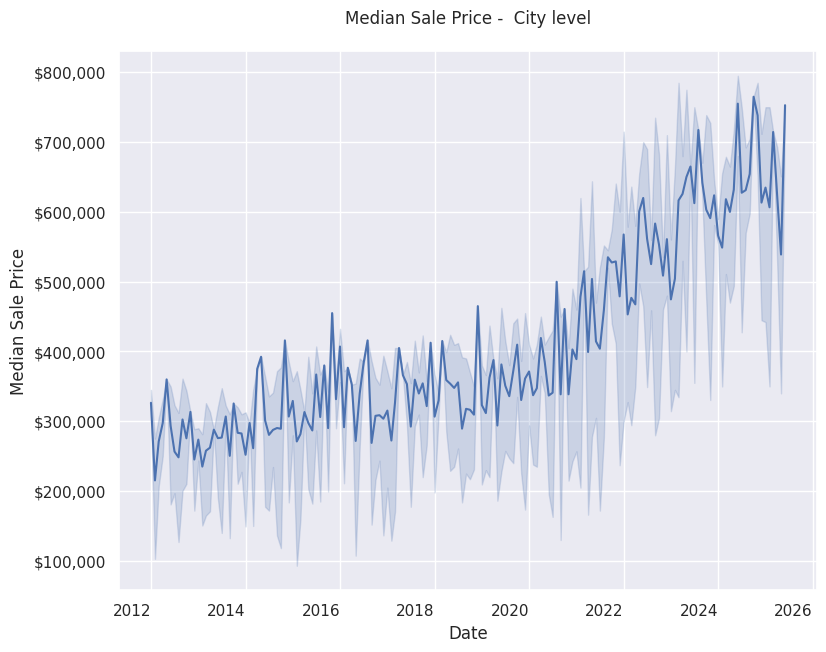
This chart, titled "Median Sale Price - City level," is a line chart displaying the median sale price of real estate properties in a city over time.
Description of the Chart:
- Type: Line chart with a shaded confidence or variability band.
- X-axis: Represents "Date," spanning from approximately early 2012 to late 2025 or early 2026.
- Y-axis: Represents "Median Sale Price" in US dollars, ranging from $100,000 to $800,000.
- Main Line: A dark blue line indicating the median sale price for each period.
- Shaded Area: A lighter blue shaded region surrounding the median line. This typically represents the variability, range (e.g., interquartile range), or a confidence interval around the median sale price, showing the dispersion of sale prices at any given time.
Summary of the Chart and Observed Trends:
The chart demonstrates a strong and consistent upward trend in median real estate sale prices in the city over the past decade, coupled with a noticeable increase in price volatility and the overall range of sale prices in recent years.
Key trends observed:
- Steady Growth (2012-2019): From 2012 to roughly late 2019, the median sale price saw a gradual but consistent increase. It started around $250,000 - $300,000 in 2012 and reached approximately $350,000 - $400,000 by late 2019. The fluctuations during this period were relatively moderate.
- Accelerated Growth (2020-Present): Beginning around early 2020, there's a significant acceleration in the upward trend. The median sale price experienced a rapid surge, climbing from approximately $400,000 in early 2020 to peaks approaching $750,000 by late 2025. This period shows a much steeper incline compared to the earlier years.
- Increased Volatility and Price Range: Concurrently with the accelerated growth from 2020 onwards, the shaded area around the median line has widened considerably. This indicates a much greater spread in individual property sale prices or increased month-to-month variability. The market has become more unpredictable, with a larger range between the lowest and highest prices sold at any given time.
- Overall Appreciation: Over the entire period, the median sale price has more than doubled, showing significant long-term appreciation in real estate values within this city.
Impact on Someone Who Wants to Purchase a Property to Start a Restaurant:
The observed trends have significant implications for a prospective restaurant owner looking to purchase property:
- Significantly Higher Capital Investment: The most immediate impact is the dramatically increased cost of acquiring property. What might have been a $300,000 investment in 2012 now costs $700,000 or more. This means a much larger down payment and overall capital outlay is required.
- Increased Debt Burden: A higher purchase price translates to a much larger mortgage loan, leading to substantially higher monthly mortgage payments and potentially higher interest costs over the life of the loan. This will significantly impact the restaurant's fixed operating costs and profitability.
- Greater Financial Risk: The increased volatility (wider shaded band) means there's more uncertainty in property values. While the trend has been upward, a market with high volatility carries a greater risk of short-term price fluctuations or even potential downturns, especially if an economic recession hits. A large investment in a volatile market requires more careful financial planning.
- Limited Affordable Options: The strong demand driving these prices might mean fewer affordable commercial properties available, or fierce competition for desirable locations. This could push a buyer towards less ideal locations or force them to pay above their initial budget.
- Longer Payback Period: With higher property costs, it will take longer for the restaurant's profits to cover the initial investment in the property, potentially delaying the return on investment (ROI).
- Consideration of Leasing vs. Buying: Given the high purchase prices, a prospective restaurant owner might strongly consider leasing a property instead of buying, at least initially. Leasing reduces upfront capital requirements, though lease rates would also likely be higher due to increased property values.
- Need for Robust Business Plan: To justify such a significant property investment, the restaurant's business plan would need to project very strong revenues and profit margins to cover the high property costs and still remain viable.
In essence, the current real estate market, as depicted, presents a much higher barrier to entry for purchasing commercial property, requiring significantly more capital and carrying greater financial risk compared to a decade ago.
Labor Market (Specific to Food Service Industry)
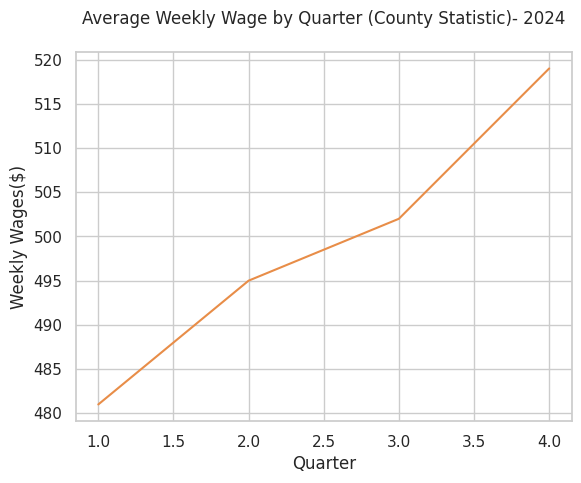
This image, showing the average weekly wage by quarter for a specific county in 2024, is highly valuable for a food service business to plan its budget, primarily concerning labor costs. Here's how it can be used:
-
Forecasting Labor Cost Increases:
- Observation: The graph clearly shows a steady increase in average weekly wages throughout 2024, starting around $481 in Q1 and rising to nearly $518 in Q4.
- Action: A food service business should anticipate higher labor expenses in subsequent quarters. This means allocating a larger portion of the budget to wages in Q2, Q3, and especially Q4 compared to Q1.
- Specifics: If a business employs 10 people, and the average wage increases by approximately $37 ($518 - $481) over the year, that's an additional $370 per week, or roughly $1,480 per month, by Q4 just from this average increase. This needs to be factored into cash flow projections.
-
Pricing Strategy Adjustments:
- Observation: Rising labor costs mean the cost of producing food and providing service is increasing.
- Action: To maintain profit margins, the business might need to consider adjusting menu prices, particularly as wages rise in the second half of the year. This data helps justify such increases and allows for proactive planning rather than reactive changes.
-
Hiring and Retention Planning:
- Observation: The general increase in average wages in the county indicates a tightening labor market or an increase in the cost of living/labor value.
- Action: The business should plan to offer competitive wages to attract and retain staff. This might mean budgeting for higher starting salaries or considering incremental raises for existing employees to prevent high turnover, especially towards the end of the year when wages are highest.
-
Operational Efficiency Investments:
- Observation: With rising labor costs, businesses often look for ways to maximize efficiency.
- Action: The budget can include investments in equipment, technology (e.g., online ordering systems, automated kitchen equipment), or staff training that can increase productivity per employee hour, thereby offsetting some of the increased wage costs.
-
Profitability Analysis and Goal Setting:
- Observation: Ignoring the rising wage trend will erode profit margins.
- Action: The business can set more realistic profit goals for each quarter, knowing that a significant cost component (labor) is expected to increase. Regular profitability analysis should track the impact of these rising wages and inform further budgetary adjustments.
-
Cash Flow Management:
- Observation: Higher expenses mean more money flowing out.
- Action: By anticipating these increases, the business can ensure it has sufficient cash reserves to cover payroll in later quarters, preventing cash flow crises.
-
Location-Specific Relevance:
- Observation: The data is a "County Statistic."
- Action: This makes the data highly relevant and actionable for a business operating within that specific county, as it reflects the local labor market conditions rather than broad national averages.
In summary, this graph provides critical forward-looking data on a key expense for food service businesses. By understanding and anticipating these wage trends, a business can make informed decisions regarding its budget, pricing, staffing, and overall financial health throughout 2024.
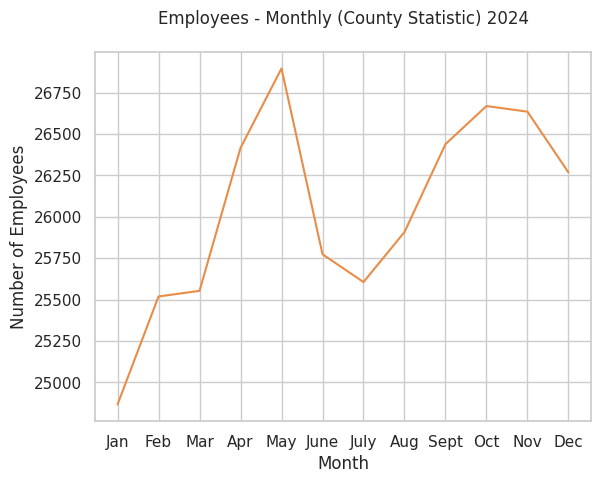
This image, showing monthly employee numbers in the restaurant industry for a specific county in 2024, can be a valuable tool for a food service business to support its staffing needs. Here's how:
-
Understand Seasonal Staffing Needs:
- Identify Peak Seasons: The graph shows significant peaks in May and then again from September to October. These are periods when the overall restaurant industry in the county expects to be busiest, requiring the most staff. A food service business should anticipate higher demand during these months and plan to increase hiring, expand employee hours, or train temporary staff in advance.
- Identify Slow Seasons: Conversely, the graph shows lower employee numbers in January, February, March, and then a dip again in July and December. These are periods when the industry as a whole is slower. A business might need to reduce staff hours, plan for fewer shifts, or perhaps schedule employee vacations during these times to align with decreased demand and manage labor costs.
-
Forecasting Sales and Demand:
- Higher employee numbers generally correlate with higher customer traffic and sales across the industry. By observing the trends (e.g., a strong rise from January to May, then a dip, then another rise to October), a business can make informed projections about their own potential sales volume month-to-month. This helps them justify staffing levels.
-
Labor Market Analysis:
- Recruitment Strategy: During peak employment months (like May and Oct), competition for skilled restaurant staff will likely be higher. Businesses should anticipate this and potentially start recruitment efforts earlier, offer more competitive wages or benefits, or broaden their hiring channels.
- Retention: During slower periods, when overall employment is down, some businesses might be reducing staff. This could be an opportunity for a well-managed business to attract experienced staff who might be looking for more stable employment, or to reinforce loyalty among existing staff.
-
Budgeting and Financial Planning:
- Staffing is a major cost for food service businesses. By understanding the predictable monthly fluctuations in industry employment, a business can better allocate its labor budget throughout the year, anticipating higher wage expenses during peak times and lower expenses during slower periods.
-
Operational Planning:
- Beyond just hiring, these trends can inform other operational decisions. For instance, during anticipated slow months (Jan-Mar, July), a business might:
- Plan for deep cleaning or maintenance that requires closing or fewer staff.
- Develop special promotions or events to stimulate demand and keep staff busy.
- Focus on staff training or menu development.
- During peak months, they might:
- Prepare for increased inventory needs.
- Optimize kitchen efficiency and service flow.
- Consider extending operating hours if feasible.
- Beyond just hiring, these trends can inform other operational decisions. For instance, during anticipated slow months (Jan-Mar, July), a business might:
In summary: This graph provides a general county-level indicator of seasonal demand and labor availability within the restaurant industry. While an individual business's specific demand might vary based on its unique factors (location, cuisine, marketing, events), this data offers a crucial macro-level baseline for proactive workforce planning, budgeting, and operational adjustments throughout the year 2024.
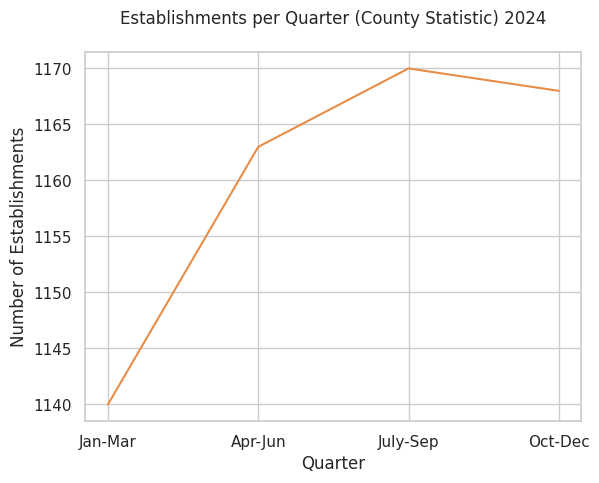
This graph provides several insights into the health of the restaurant industry in this specific county for 2024:
-
Overall Growth (Jan-Sep): The most significant insight is that the number of food service establishments generally increased for the first three quarters of 2024, from approximately 1140 in Jan-Mar to a peak of 1170 in July-Sep. This upward trend suggests a healthy and expanding industry, indicating:
- Strong Consumer Demand: There's enough customer spending to support more restaurants.
- Entrepreneurial Confidence: New businesses are opening, or existing ones are expanding.
- Economic Vibrancy: The local economy is likely robust enough to encourage investment in the food service sector.
-
Peak in Q3 (Summer/Early Fall): The number of establishments peaked in the July-Sep quarter. This could be due to:
- Seasonal Factors: Summer months often see increased tourism, outdoor dining, and generally higher activity, leading to more temporary or seasonal establishments, or a boost for permanent ones.
- Sustained Growth: A sign that the positive momentum from earlier in the year continued well into the warmer months.
-
Slight Decline/Stabilization in Q4: The slight decrease from 1170 establishments in July-Sep to approximately 1167 in Oct-Dec is worth noting. While not a steep decline, it could indicate:
- Seasonal Closures: Some businesses, especially those reliant on outdoor seating or tourism, might close or operate seasonally.
- Market Saturation: The growth might be reaching a point of saturation, where the number of new openings begins to slow, or closures increase slightly.
- Cooling Off: A minor contraction or a slowing of growth could signal a slight downturn in consumer spending or increased operational challenges (e.g., winter weather impacting foot traffic).
What this information doesn't tell us (and why more data would be better):
- Profitability: An increasing number of establishments doesn't necessarily mean they are all profitable. It only counts their existence.
- Employment: It doesn't show the number of jobs created or lost.
- Revenue: We don't know the overall sales volume or revenue for the industry.
- Comparison to Previous Years: Without historical data, we can't tell if this 2024 trend is typical, exceptionally good, or a recovery from a previous downturn.
- Specific Segments: It groups all "food service establishments" together (fine dining, fast food, cafes, etc.), which might mask different trends within specific segments.
- Causes: While we can infer potential reasons for the trends (e.g., seasonality, economic conditions), the graph itself doesn't provide the causal factors.
In summary: Based on the number of establishments, the restaurant industry in this county showed healthy growth through the first three quarters of 2024, suggesting a positive economic environment and strong demand. The slight dip in the last quarter warrants observation but does not negate the overall positive trend for most of the year.
Incentives Available
Farragut, Tennessee is an attractive location for businesses due to its affluent demographics, high traffic counts, and strong community. While the Town of Farragut may not offer direct cash grants specifically for every new restaurant, there are several forms of support, resources, and a generally favorable environment that act as incentives.
Here's a breakdown of what's available:
I. Local (Town of Farragut) Support & Environment
-
Economic Development Staff/Resources: The Town of Farragut has staff (often within their Planning or Community Development departments) dedicated to helping businesses navigate the process of opening and operating within the town. They can provide:
- Guidance on Zoning & Permitting: Assistance with understanding specific zoning requirements for commercial properties, obtaining necessary building permits, health department approvals, and business licenses. While not a direct "incentive," efficient navigation of these processes saves time and money.
- Site Selection Information: Data on traffic counts, demographics, available commercial properties, and future development plans.
- Networking Opportunities: Connections to local business organizations and other community resources.
-
Façade Improvement Programs (Potential): Some well-established towns, like Farragut, occasionally implement façade or streetscape improvement programs in specific commercial districts to enhance aesthetics. While not always active or universal, it's worth inquiring if such programs exist for the area you're considering, as they can offset costs for exterior renovations.
-
Business-Friendly Climate: Farragut prides itself on being a desirable place to live and do business. This often translates to:
- Clear Regulations: While regulations exist, they are generally well-defined, making the process predictable.
- Community Support: A local government that generally supports quality business development.
-
Excellent Demographics & Customer Base: This is perhaps the biggest "indirect incentive" for a restaurant:
- High Household Income: Farragut boasts one of the highest median household incomes in the region, meaning residents have significant disposable income for dining out.
- Strong Population Growth: A growing customer base.
- High Traffic Counts: Key commercial corridors (like Kingston Pike) offer excellent visibility and access for restaurants.
II. Regional & State of Tennessee Incentives
-
Tennessee Department of Economic & Community Development (TNECD): While many TNECD programs are geared towards larger employers, some initiatives might indirectly benefit small businesses or be accessible through local partnerships:
- FastTrack Program: Primarily for job creation and capital investment for larger projects, but sometimes can be leveraged for significant developments that include restaurant components.
- Job Tax Credit: For businesses creating a certain number of new full-time jobs.
- Small Business Resources: TNECD often partners with local organizations to provide resources and support to small businesses.
-
Small Business Administration (SBA) Loans: These are federal programs administered through local lenders and are crucial for many small businesses, including restaurants:
- SBA 7(a) Loans: The most common type, offering flexible financing for various business needs, including working capital, equipment, and real estate.
- SBA 504 Loans: For major fixed assets like real estate and equipment, often at long-term, fixed rates.
- Microloans: Smaller loans for startups and small businesses.
-
Small Business Development Centers (SBDCs): The Tennessee SBDC network, often affiliated with universities (like the one at Pellissippi State Community College or the University of Tennessee, Knoxville), offers free or low-cost services:
- Business Plan Development: Essential for securing financing.
- Financial Projections: Assistance with forecasting your restaurant's finances.
- Marketing Strategy: Guidance on how to reach your target customers.
- Loan Packaging Assistance: Help in preparing your loan application.
-
SCORE Mentors: A non-profit organization that provides free business mentoring and workshops to small business owners. They can offer invaluable advice from experienced professionals across various industries, including food service.
-
No State Income Tax: Tennessee does not have a state income tax, which can be a significant advantage for business owners.
III. Private & Indirect Incentives
-
Local Chambers of Commerce / Business Alliances:
- Knoxville Chamber of Commerce: While not Farragut-specific, the Knoxville Chamber serves the entire region and offers networking events, business development resources, and advocacy.
- Farragut Business Alliance (or similar local groups): These organizations focus specifically on promoting businesses within Farragut and can offer direct networking, marketing support, and a collective voice for local businesses.
-
Commercial Real Estate Deals: Depending on market conditions and the specific property, landlords might offer incentives like reduced rent for initial months, tenant improvement allowances, or longer lease terms to attract quality restaurant tenants.
How to Best Explore Incentives:
- Contact the Town of Farragut: Start with the Planning & Community Development Department or look for an "Economic Development" contact on the official Town of Farragut website. They are your primary resource for local information.
- Reach Out to the Knoxville Chamber of Commerce: Inquire about regional programs and connections.
- Consult the Tennessee Small Business Development Center (TSBDC): For assistance with business planning, financial projections, and navigating SBA loan options.
- Develop a Robust Business Plan: A well-researched and detailed business plan is crucial for accessing any form of funding or support, as it demonstrates viability and commitment.
By leveraging these resources, a prospective restaurant owner in Farragut can significantly improve their chances of a successful launch.
Disclaimer: PICCKI offers preliminary insights into food service site suitability based on your input. It should not replace thorough due diligence, expert consultation (legal, health, zoning, etc.), or verification of all applicable regulations. You are responsible for ensuring full compliance with all local, state, and federal requirements.
