Get Started
Order Number: 311b35e4-d33b-4288-a5bf-cf27c360aa63
Order Date: 2025-09-21 23:34:25.852467
Location: Latitude: 34.0586 Longitude: -118.207 Map
Version Number: 2025-V01
Table of Contents
Location suitability Target Market Demography Competition Amenities Real Estate Labor Market IncentivesExecutive Summary
Here is a summary of the insights from the report:
- Los Angeles offers high opportunities for food service but presents significant challenges due to intense competition, high operating costs, and complex regulations.
- Site suitability is critical, requiring alignment with target audience demographics, excellent visibility, adequate parking, and compliance with zoning/infrastructure requirements.
- The 15-minute drive-time Region of Influence (ROI) offers approximately 41,000 potential customers, with specific dense residential areas ideal for targeted advertising.
- The population is linguistically diverse, with dominant Spanish and English speakers, significant Chinese, and viable niche markets for Korean, Filipino, and Vietnamese cuisines.
- Income levels within the ROI vary significantly ($32k-$128k), necessitating a hyper-local business concept tailored to specific income segments rather than a broad approach.
- The competitive landscape is dense, with 9 fast food and 11 full-service restaurants within a 15-minute walk. Most competitors have strong ratings (4.2-4.8), highlighting the need for unique concepts and exceptional quality.
- Accessibility varies by direction; marketing should leverage easier access from the East (11 mins/5 miles) and prioritize robust delivery services for less accessible North/South directions.
- Real estate costs are high, having tripled since 2012, with recent plateauing but continued volatility, requiring substantial capital investment.
- The labor market shows seasonal fluctuations in wages and employment, but the overall food service industry in the county is healthy, growing, and experiencing positive market conditions.
- Numerous financial incentives (e.g., SBA loans, CDFIs, utility rebates) and business support resources (e.g., SBDCs, LA City Business Portal) are available to assist new establishments.
Location Suitability
Starting a food service business in Los Angeles, California, offers immense opportunities due to its diverse population, robust tourism, and a strong culinary culture. However, it also presents significant challenges, primarily high costs, intense competition, and complex regulations.
To provide specific site suitability details, we need to consider both the general Los Angeles market context and the specific factors that make an individual site feasible.
General Los Angeles Market Suitability
Feasibility Score: High Opportunity, High Challenge
Strengths (Opportunities):
- Massive and Diverse Customer Base: LA is a sprawling metropolis with nearly 4 million residents in the city proper and over 13 million in the wider metropolitan area. This diverse population offers a market for almost any cuisine or concept – from high-end dining to casual eateries, ethnic specialties, healthy options, and fast-casual.
- Strong Food Culture & Trends: Angelenos are generally food-savvy, adventurous eaters, and often early adopters of culinary trends (e.g., plant-based, farm-to-table, experimental concepts). This allows for innovation and niche markets.
- Tourism: Millions of tourists visit LA annually, providing an additional, often affluent, customer segment, especially in popular areas.
- Delivery Economy: LA has a highly developed food delivery infrastructure, which is crucial for reaching customers who prefer convenience.
- Affluent Pockets: Numerous affluent neighborhoods can support higher price points and premium dining experiences.
- Outdoor Dining Potential: Favorable weather allows for year-round patio dining, which is a significant draw.
Weaknesses (Challenges):
- Extremely High Competition: The LA food scene is saturated. You will be competing with established brands, Michelin-starred restaurants, popular local joints, and new entrants daily.
- High Operating Costs:
- Rent: Commercial rents are among the highest in the nation, especially in desirable areas.
- Labor: California's minimum wage is high and continues to rise, impacting labor costs significantly.
- Utilities: High operational costs for electricity, gas, and water.
- Insurance: High liability insurance costs.
- Complex Permitting & Regulations: Navigating LA County Department of Public Health (DPH), city planning, fire department, and other agencies can be time-consuming, costly, and complex. This includes specific requirements for grease traps, ADA compliance, noise, and signage.
- Traffic & Parking: LA is infamous for its traffic. Adequate parking (or proximity to public transport/walkability) is absolutely critical for most concepts.
- High Failure Rate: Due to the combination of high costs and intense competition, the food service industry in LA has a significant failure rate.
Ideal Site Suitability Factors (Specific Location)
Regardless of the neighborhood, a specific site must be evaluated against these critical criteria:
-
Demographics & Target Audience Alignment:
- Foot Traffic/Vehicle Traffic: Is there consistent activity that matches your customer profile?
- Residential Density: Are there enough residents nearby to support the business, especially during off-peak hours?
- Workplace Density: If targeting lunch or after-work crowds, are there office buildings, schools, or other institutions nearby?
- Income Levels: Do local income levels support your proposed price point?
- Age/Lifestyle: Does the local demographic align with your concept (e.g., young professionals, families, seniors, tourists)?
-
Visibility & Accessibility:
- Storefront Presence: Is the location easily visible from the street? Clear signage potential?
- Access: Easy to enter/exit for both pedestrians and vehicles.
- Public Transit: Proximity to bus stops, Metro stations can be a major plus, especially in dense urban areas.
- Walkability: Is the area walkable, encouraging casual visits?
-
Parking:
- Dedicated Parking: On-site parking (e.g., lot, garage) is a massive advantage in LA.
- Street Parking: Availability and restrictions (meters, permit zones) for street parking.
- Nearby Public/Paid Lots: Proximity to structures where customers can park.
- Lack of convenient parking can be a death sentence for many LA businesses.
-
Competition Analysis:
- Direct Competitors: How many similar businesses are nearby? What are their strengths/weaknesses?
- Indirect Competitors: Are there other dining options that might draw your target customer?
- Market Gaps: Is there an unmet demand for your specific cuisine or concept in the area?
-
Zoning & Permitting:
- Commercial Zoning: Ensure the property is zoned for food service (e.g., C-1, C-2, C-M).
- Conditional Use Permits (CUP): Some uses (e.g., alcohol sales, late-night hours, live music) require special permits that can be difficult or impossible to obtain in certain areas.
- Health Department Approvals: The kitchen layout, equipment, and operations must meet strict LA County DPH standards.
- Building Codes: ADA compliance, fire safety, earthquake retrofitting.
-
Infrastructure & Utilities:
- Kitchen Infrastructure: Does the existing space have adequate electrical capacity (200A+ is common for commercial kitchens), gas lines, water lines, and drainage?
- Grease Trap/Interceptor: Essential for food service; does the site have one, or can one be installed easily and cost-effectively? This is a significant expense if not present.
- HVAC: Adequate heating, ventilation, and air conditioning for both the kitchen and dining areas.
- Restrooms: Number of restrooms required based on seating capacity, ADA compliance.
- Waste Management: Space for dumpsters, easy access for waste removal.
-
Space Layout & Condition:
- Kitchen Flow: Can a functional and efficient kitchen be designed within the space?
- Dining Area: Sufficient space for seating, comfortable for customers.
- Storage: Ample space for dry goods, refrigeration, supplies.
- Frontage & Signage: Good visibility and potential for attractive exterior.
- Condition: What is the cost and scope of necessary renovations (tenant improvements)? "Second-generation restaurant spaces" can save significant build-out costs if the existing infrastructure (grease trap, hood system) is suitable.
-
Lease Terms & Costs:
- Base Rent: Per square foot and total monthly.
- CAM (Common Area Maintenance) Fees: Additional costs for shared expenses.
- Lease Term: Duration, options for renewal.
- Build-Out Allowance/Tenant Improvement (TI): Does the landlord offer any contributions to renovation costs?
- Escalations: How much will rent increase over time?
-
Safety & Security:
- Neighborhood Crime Rate: Is the area safe for staff and customers, especially during evening hours?
- Lighting: Adequate street and storefront lighting.
Top LA Neighborhoods (Examples & Their Feasibility Nuances)
The "best" neighborhood depends entirely on your concept, budget, and target audience. Here are a few examples:
-
West Hollywood / Beverly Hills / Silver Lake / Echo Park (High Demand, High Cost, Trendy):
- Feasibility: Excellent for unique, high-end, or trendy concepts with a strong brand identity. Attracts affluent residents, celebrities, and tourists. High foot traffic and visibility.
- Challenges: Astronomical rent, intense competition, difficult parking, complex permitting for new construction or changes.
-
Downtown LA (DTLA - Arts District, Historic Core, South Park) (Evolving, Diverse):
- Feasibility: Great for diverse concepts targeting a mix of office workers, residents (many young professionals), tourists, and event-goers. Rapidly growing residential population. Good public transport access.
- Challenges: Still has some areas with high transient populations, can be less active on weekends in parts, parking can be expensive in garages, high competition.
-
Santa Monica / Venice (Beach Culture, Tourist-Heavy):
- Feasibility: Ideal for casual, healthy, plant-based, or tourist-focused concepts. High foot traffic near the beach and popular shopping streets (e.g., 3rd Street Promenade, Abbot Kinney Blvd).
- Challenges: Extremely high rent, very difficult parking (especially near the beach), heavy tourist seasonality, high competition.
-
Culver City (Tech Hub, Growing):
- Feasibility: Excellent for concepts targeting tech professionals, families, and a growing residential base. More accessible parking than some other areas. Strong lunch and dinner crowd.
- Challenges: Rents are rising rapidly, competition from established eateries.
-
Koreatown (Dense, Late-Night, Specific Cuisine):
- Feasibility: Perfect for Korean cuisine, late-night dining, and vibrant, community-focused concepts. Very dense residential and commercial area, strong local support.
- Challenges: Parking can be a nightmare, highly specialized market, competition within specific cuisines is fierce.
-
Pasadena (Suburban Affluence, Family-Friendly):
- Feasibility: Good for family-friendly, casual dining, and upscale-casual concepts. Strong local resident base, less transient than central LA. Old Pasadena offers good foot traffic.
- Challenges: Less "trendy" than central LA, competition from national chains, can be slower on weekdays outside Old Pasadena.
Conclusion
Los Angeles is a land of opportunity for a food service business, but it demands meticulous planning and a well-defined strategy. The most feasible location for your business is one that perfectly aligns with your specific concept, target audience, budget, and operational needs.
Before committing to any site, you MUST:
- Develop a detailed business plan: Clearly define your concept, menu, pricing, target market, and financial projections.
- Conduct thorough market research: Understand the demographics, competition, and trends in specific neighborhoods.
- Engage professionals: Work with an experienced commercial real estate broker specializing in restaurant leases, a restaurant consultant, and a permit expediter.
- Perform rigorous due diligence: Verify zoning, permitting requirements, infrastructure capabilities, and hidden costs before signing any lease.
While the rewards can be significant, the challenges in LA's food service market are equally substantial. Success hinges on a unique concept, an ideal location, strong financial backing, and relentless execution.
Target Market
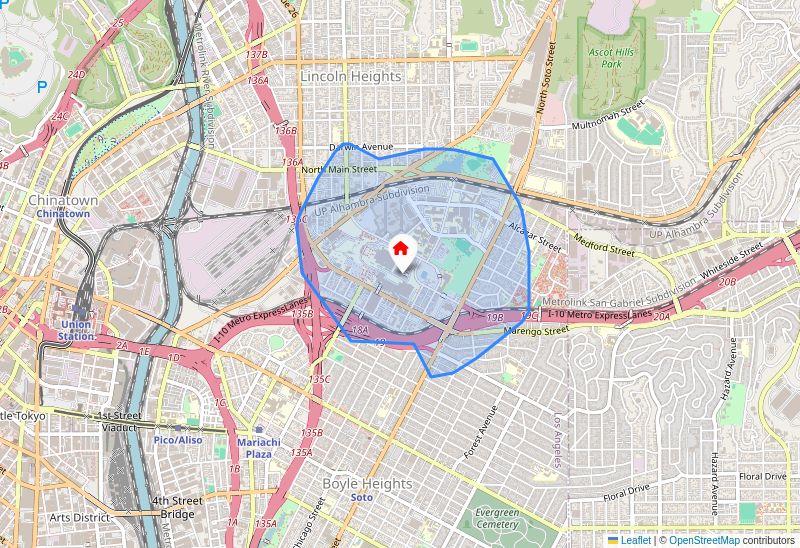
Region of Influence (ROI)
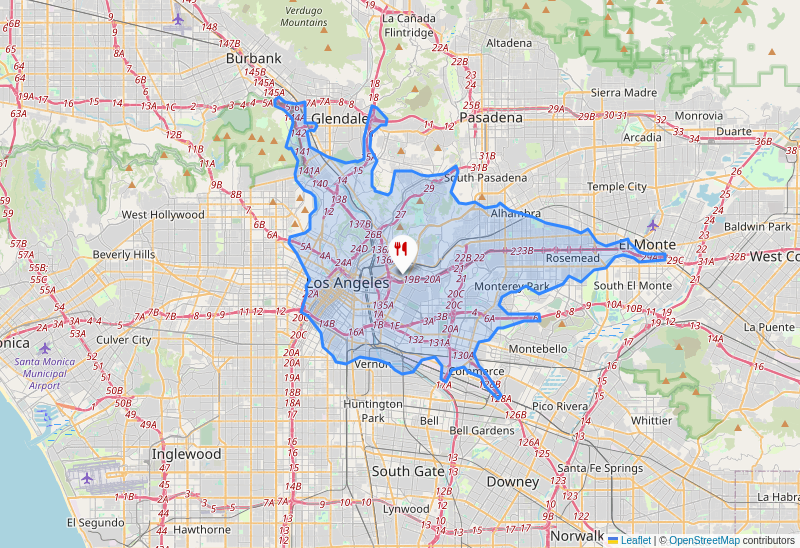
The average consumer travels about 15 minutes for casual meals, but incentives like cash back offers can motivate them to travel up to 30 minutes. PICCKI chooses a 15 minute travel distance as the Region of Influence (ROI).
The ROI represents "Equals-time" driving to your site location. This approach directly addresses key factors that influence customer patronage to your location, moving beyond simple radial distances to consider actual travel time.
Residential Density
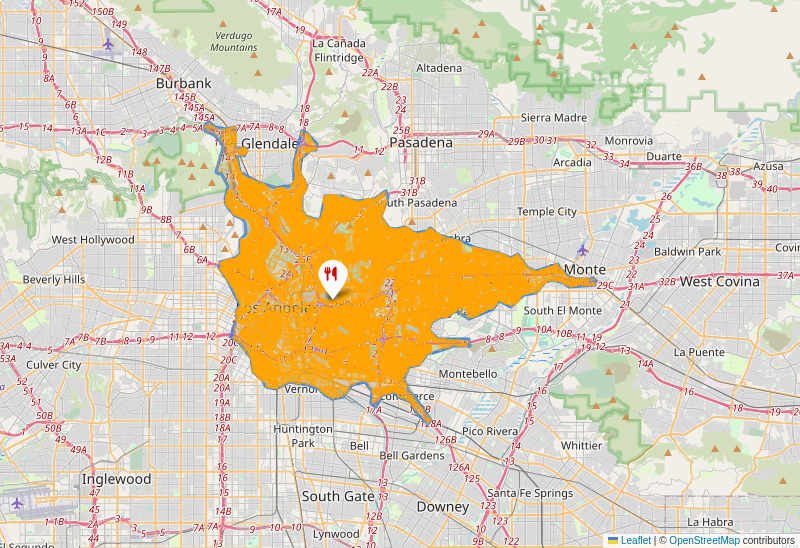
Individual addresses will be useful for direct advertising campaigns
The "orange areas" (residential parcels) within the 15-minute ROI provides actionable intelligence. It provides a practical understanding of where potential customers actually live, enabling more precise and effective business strategies. The dense orange areas represent the most efficient and profitable zones for delivery services due to higher order density of customers.
🎯 Geofencing: Implement digital marketing strategies that target mobile users within or around these orange residential clusters.
🤝 Local Partnerships: Explore partnerships with community organizations, apartment complexes, or local businesses within dense residential zones for promotions or events.
📬 Direct Mail/Flyers: Consider physical marketing and focus distribution efforts heavily in these areas.
There are a total of 148496 households to which targeted advertisement can be sent. While social media campaigns can be effective they can be very costly. A targeted campaign might be a good option if you are starting a new restaurant. Research has shown that targeted advertisement can be more effective in garnering user interest.
Market Size
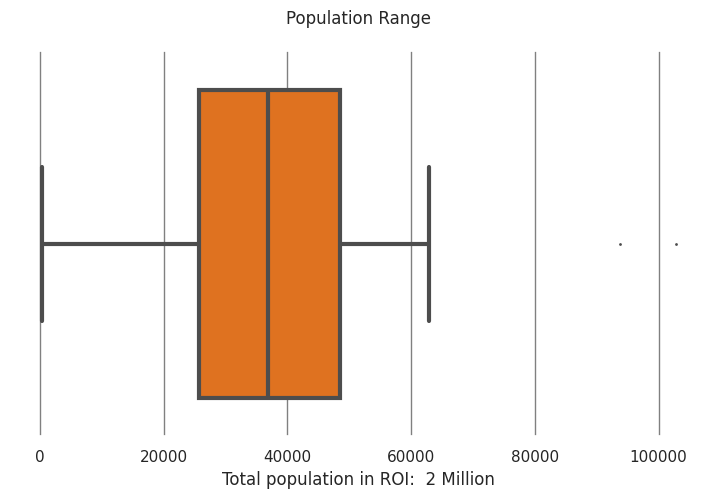
This box chart illustrates the distribution of potential customer populations within various Regions of Influence (ROIs) for a restaurant site.
Based on the main orange box plot, here's a summary of the accessible population:
- Median Population: The typical or median ROI for a restaurant site provides access to approximately 41,000 people.
- Middle 50%: Fifty percent of the considered ROIs have an accessible population ranging from about 25,000 (25th percentile) to 48,000 people (75th percentile). This means that for half of the potential sites, the population within their region of influence falls within this range.
- Most ROIs: The majority of ROIs (excluding extreme outliers) provide access to populations between roughly 2,000 (minimum value on the whisker) and 62,000 people (maximum value on the whisker).
- Outliers: There are a few outlier ROIs that offer significantly larger populations, reaching up to approximately 95,000 and 100,000 people.
In essence, while the overall potential market might be indicated as "2 Million," this chart suggests that a single restaurant site would typically have access to a population ranging from the low thousands up to about 62,000, with a strong central tendency around 41,000. Some rare, high-potential sites could reach populations of 95,000 to 100,000.
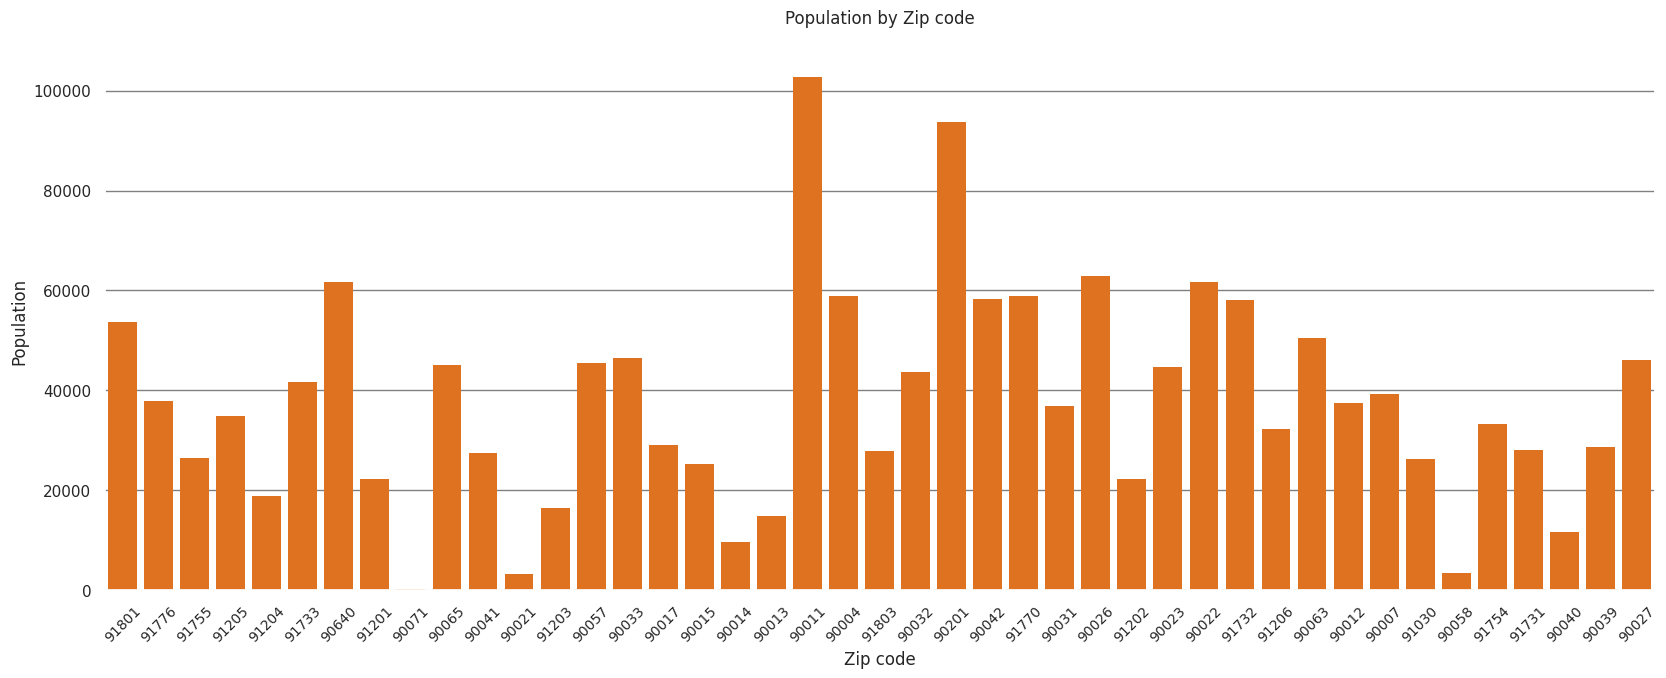
The bar chart displaying population by zip code in the Region of Influence (ROI) is a crucial tool for making site suitability decisions for a food service business. Here's how the distribution of population impacts these decisions:
1. Identifying Potential Customer Base: * Direct Correlation: Population size directly correlates with the number of potential customers available within a given zip code. A higher population generally means a larger addressable market for a food service business. * High-Potential Zip Codes: Zip codes with significantly higher populations (e.g., 90013 and 90040 both exceeding 100,000; 90011 and 90004 close to 90,000; 90057, 90033, 90065, 91733, 91801 all over 60,000) would be highly attractive as they offer the largest potential customer pools. These areas promise a greater volume of transactions if the business can capture even a small percentage of the local residents. * Moderate-Potential Zip Codes: Areas with populations ranging from 30,000 to 50,000 (e.g., 91776, 91205, 90071, 90017, 90026, 91754, 90039, 90027) could still be viable, especially if they have favorable demographics, less competition, or other specific draws. * Low-Potential Zip Codes: Zip codes with very low populations (e.g., 90021 with a population below 5,000; 90014, 90012, 90058 all below 20,000) would be generally unsuitable for most food service businesses relying on a broad customer base. It would be challenging to generate sufficient revenue from such a small population pool, unless the business targets a very specific niche or has a very unique draw that transcends zip code boundaries.
2. Guiding Marketing and Outreach: * Targeted Advertising: Knowing the population density helps a business strategically allocate marketing resources. Areas with higher populations might warrant more intensive local advertising to reach a broader audience. * Delivery Zones: For businesses offering delivery, targeting higher population density zip codes can lead to more efficient delivery routes and higher order volumes.
3. Influencing Business Model and Concept: * High-Volume vs. Niche: In densely populated areas, a food service business might aim for a high-volume model, potentially with a broader appeal. In lower-density areas (if chosen for other reasons), a more niche, destination-oriented concept might be necessary. * Staffing and Inventory: Higher anticipated customer traffic in populous areas means planning for more staff, larger inventory, and efficient operations.
4. Interacting with Other Site Selection Factors: While population is critical, it's rarely the only factor. It needs to be considered alongside: * Demographics: Beyond raw numbers, who are these people? Age, income, lifestyle, and cultural preferences will influence the type of food service business that thrives. For instance, a zip code with a high elderly population might prefer different food options than one with a young professional demographic. * Competition: High-population areas often attract more competitors. A business needs to assess the existing food service landscape and identify gaps or opportunities for differentiation. * Traffic & Accessibility: Even a high-population zip code needs specific sites with good visibility, easy access, parking, and foot traffic generators (e.g., offices, retail centers, residential hubs). * Real Estate Costs: Densely populated areas often come with higher rents and property costs. The potential revenue from a larger customer base must justify these increased operational expenses. * Daytime vs. Nighttime Population: Some zip codes might have a large daytime work population but sparse nighttime residents, impacting business hours and concepts (e.g., a lunch spot versus a dinner restaurant).
In summary, the population distribution across zip codes provides a fundamental understanding of the potential market size. For a food service business, the chart clearly indicates that concentrating efforts on zip codes with high populations offers the greatest potential for success by maximizing the available customer base, while zip codes with very low populations pose significant challenges and would likely only be viable under very specific, niche circumstances.
Top 5 Zip codes by Population
| Zip code | Population |
|---|---|
| 90011 | 102784 |
| 90201 | 93783 |
| 90026 | 62902 |
| 90022 | 61638 |
| 90640 | 61615 |
Try
Demography
Cuisine Potential
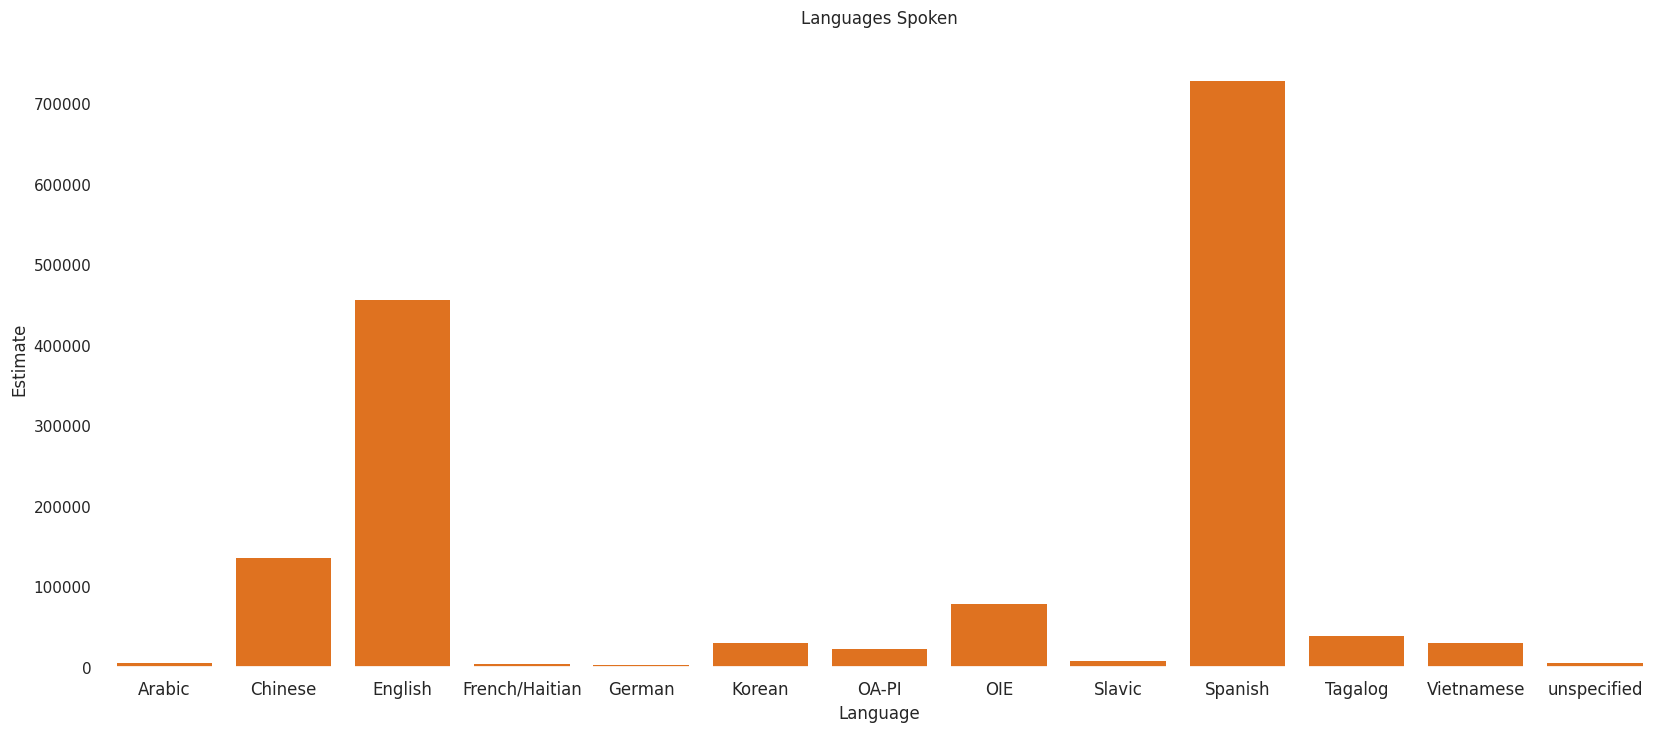
This bar chart, "Languages Spoken" in your designated Region of Influence (ROI), provides valuable insights into the linguistic diversity of the population, which directly correlates with potential customer bases for various cuisine types.
Here's a summary of the chart and its implications for a restaurant owner:
Overall Assessment: The ROI exhibits a highly diverse linguistic landscape, with two overwhelmingly dominant languages (Spanish and English), followed by a substantial Chinese-speaking population, and several other significant ethnic communities. This diversity suggests a strong potential for a wide range of international cuisines.
Key Findings and Cuisine Potential:
-
Spanish (Dominant Market - ~730,000 speakers):
- Potential: This is the largest single language group by a significant margin. A restaurant specializing in Mexican, Latin American (e.g., Salvadoran, Colombian, Peruvian), or traditional Spanish cuisine would find an extremely large and readily available target audience. Menus and staff bilingual in Spanish would be highly advantageous.
-
English (Major Market - ~450,000 speakers):
- Potential: English is the second-largest group, representing a broad demographic. Restaurants offering American cuisine, broadly international dishes, fusion concepts, or any generally appealing cuisine would find a substantial English-speaking customer base. All restaurants should, of course, cater to English speakers.
-
Chinese (Significant Market - ~135,000 speakers):
- Potential: There is a very strong presence of Chinese speakers. This indicates a high demand for various types of Chinese cuisine (e.g., Cantonese, Sichuan, Hunan, Dim Sum). A well-executed Chinese restaurant would likely attract a considerable and dedicated clientele.
-
Other Indo-European (OIE) (Notable Niche - ~80,000 speakers):
- Potential: This category suggests a diverse European population. While not as concentrated as Spanish or Chinese, it could support restaurants with broader European influences (e.g., Italian, French, Greek, Eastern European), especially if they appeal to a wider audience.
-
Korean, Tagalog (Filipino), and Vietnamese (Viable Niche Markets - ~30,000-40,000 speakers each):
- Potential: These groups are smaller than the top three but still represent significant populations. Dedicated restaurants offering Korean BBQ, Filipino cuisine, or Vietnamese pho/cuisine could find a loyal customer base, particularly if the area lacks sufficient options for these specific cuisines. These are strong indicators for successful niche restaurants.
-
Smaller Language Groups (Arabic, French/Haitian, German, OA-PI, Slavic, Unspecified - <10,000 speakers each):
- Potential: While individually small, these groups contribute to the overall diversity. A restaurant targeting solely one of these smaller groups might struggle due to limited market size, but a restaurant offering diverse international options, Mediterranean, or generally popular dishes might appeal to segments of these communities. They add to the general "diverse foodie" demographic.
Conclusion for a Restaurant Owner:
Based on the language data:
- High Probability of Success: A restaurant focusing on Spanish/Latin American or Chinese cuisine has the largest built-in audience and a high chance of success, assuming quality food and service.
- Strong Niche Opportunities: Restaurants specializing in Korean, Filipino (Tagalog), or Vietnamese cuisine also have a solid foundation for a dedicated customer base.
- Broad Appeal: Any restaurant catering to the general public should have a strong English-language offering, but integrating Spanish into menus and staff communication is almost essential for maximum reach.
- Capitalizing on Diversity: The overall diversity suggests that an establishment offering high-quality, authentic dishes from any of these major groups is likely to thrive. Fusion concepts or restaurants that can cater to multiple cultural palates could also do very well.
To confirm the best cuisine type, further research into existing competition, local food trends, and specific income/lifestyle demographics within the ROI would be beneficial, but this language data provides a very strong starting point for identifying viable culinary ventures.
Income
This income data provides crucial insights for a new food service business. The most striking takeaway is the significant economic diversity within the "Area Covered" and its overall lower average median income compared to the California state average.
Here's a summary of how someone can use this information to inform their strategy:
1. The Overarching Truth: Location, Location, Location (and Target Market Definition)
- Average Median Income ($70,521): This tells you the typical household in the area earns significantly less than the state average ($96,334). This suggests that value, affordability, and practical dining options will likely be more successful broadly than high-end luxury.
- Range Median Income ($32,250 to $128,105): This is the most critical piece of data. It reveals that the "Area Covered" is not a monolithic market. It contains distinct economic pockets. Your success will absolutely hinge on which specific part of this range you choose to target and where you locate.
2. Tailoring Your Concept Based on Micro-Market Analysis:
You cannot effectively target the entire income range with a single food service concept. You must choose your target demographic within this range.
-
If targeting the Lower End ($32,250 - $50,000):
- Concept: Focus on highly affordable, high-value, comfort food, quick-service, family-friendly options, or ethnic cuisine that caters to budget-conscious consumers. Think fast-casual, diner, take-out focused, or efficient counter service.
- Menu: Prioritize generous portions, combo deals, daily specials, and staple items with broad appeal.
- Pricing: Extremely competitive, emphasizing affordability and "bang for your buck."
- Operations: Must be highly efficient to manage costs and turn tables quickly.
-
If targeting the Mid-Range ($50,000 - $90,000):
- Concept: Casual dining, quality ingredients, good atmosphere, and a diverse menu that appeals to families and professionals. This segment represents the "average" of the area. Think gastropubs, health-conscious cafes, mid-tier sit-down restaurants, or places offering strong lunch and dinner options.
- Menu: A balance of familiar and slightly more adventurous dishes. Options for different dietary needs.
- Pricing: Moderate, offering good value for the quality and experience.
- Value Proposition: Focus on consistency, fresh ingredients, friendly service, and a comfortable environment.
-
If targeting the Higher End ($90,000 - $128,105):
- Concept: More refined dining experiences, unique cuisine, specialty ingredients, craft beverages, and a focus on ambiance and service. This segment, while higher income for the area, is still at the state median, so it's not ultra-luxury, but could support an upscale casual or bistro model.
- Menu: Creative dishes, seasonal ingredients, curated wine/beer list, and attention to presentation.
- Pricing: Higher, reflecting the quality of ingredients, preparation, and dining experience.
- Value Proposition: Emphasis on experience, quality, uniqueness, and perhaps convenience (e.g., gourmet takeout, catering).
3. Strategic Recommendations for the Business:
- Hyper-Local Demographic Research: Before committing to a location, use tools like census data, local real estate reports, and on-the-ground observation to pinpoint the specific median income and demographic profile of the immediate neighborhood where you plan to open. Is it closer to the $32,250 end, the $128,105 end, or somewhere in the middle?
- Competitive Analysis: Understand what existing food businesses are doing in your chosen micro-market. What's working? What's missing? How are they priced?
- Marketing & Branding: Your marketing message must resonate with your chosen income segment.
- For lower incomes: Focus on deals, family value, quick service, and affordability.
- For higher incomes: Focus on quality, experience, unique offerings, and convenience.
- Cost Management: Given the overall lower average income of the area, maintaining tight control over your operational costs (food, labor, rent) will be paramount, regardless of your target segment, to ensure profitability and offer competitive pricing.
- Consider Multi-Concept Expansion: If your business is successful and you wish to expand, you might consider opening different concepts (perhaps under the same parent company) to cater to the different income segments in other parts of the "Area Covered."
In summary, this data screams "don't treat this area as one market." Your strategy must be highly focused and precisely tailored to the specific income bracket and corresponding consumer behavior of your chosen immediate location within the "Area Covered."
Job Opportunity
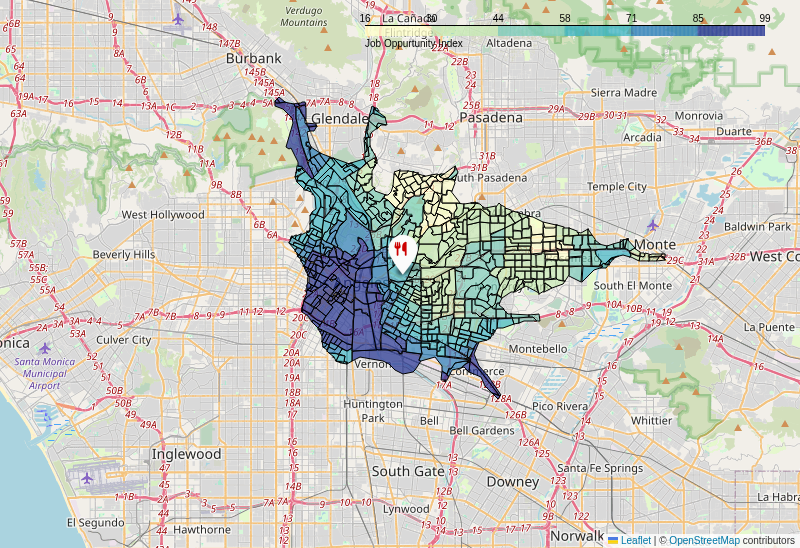
Higher Customer Base: Areas with a high concentration of job opportunities likely have a larger daytime population due to employees working in those areas. This translates to a larger potential customer base for restaurants, especially during lunch hours and after work.
Increased Spending Power: Areas with more businesses and jobs often have a higher concentration of people with disposable income, leading to more frequent dining out and potentially higher average spending per customer.
Business Catering and Events: Businesses located in high job opportunity areas may generate demand for catering services for meetings, events, and corporate lunches, providing an additional revenue stream for restaurants.
📉 Negative Impacts (Areas with Low Job Opportunity Index - Greener Areas):Lower Customer Base: Areas with fewer job opportunities typically have a smaller daytime population, leading to a reduced potential customer base, especially during weekdays.
Reliance on Local Residents: Restaurants in these areas may be more reliant on the local residential population, which might have different dining habits and spending patterns compared to a business-heavy area.
🎯 Strategic Considerations:Location Decisions: For new restaurants, the Job Opportunity Index can be a crucial factor in site selection. Areas with a high index might offer greater revenue potential, although competition could also be higher.
Marketing Strategies: Restaurants in high job opportunity areas might tailor their marketing towards the working population (e.g., lunch specials, happy hour). Restaurants in lower index areas might focus more on local residents and weekend crowds.
Competition
Price Levels
Price Level Categories:
- Free: Free or low-cost food programs
- $ (Inexpensive): Typically $10 and under per person
- $$ (Moderate): Generally $11-$30 per person
- $$$ (Expensive): Usually $31-$60 range
- $$$$ (Very Expensive): Generally $60+
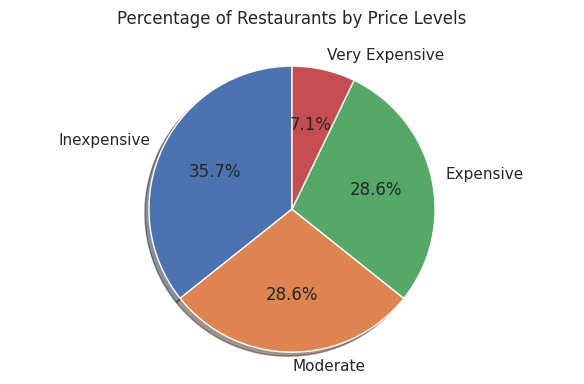
This pie chart illustrates the percentage distribution of restaurants by price level in a specific location, providing insights for someone considering opening a new restaurant.
Summary of the Image:
The chart titled "Percentage of Restaurants by Price Levels" shows the following breakdown:
- Inexpensive: Represents the largest segment, accounting for 35.7% of all restaurants.
- Moderate: Makes up 28.6% of the restaurants.
- Expensive: Also accounts for 28.6%, mirroring the "Moderate" category.
- Very Expensive: Is the smallest segment, with only 7.1% of the restaurants.
In essence, the market is predominantly served by "Inexpensive" restaurants, followed by an equal distribution of "Moderate" and "Expensive" options. "Very Expensive" establishments are a niche market.
Guidance for Starting a New Restaurant Based on This Image:
For someone looking to start a new restaurant at this location, this data provides a glimpse into the current competitive landscape based on pricing strategy:
-
Consider the "Inexpensive" Market (35.7%):
- Opportunity: This is the largest segment, suggesting a high demand for affordable dining. If you can offer exceptional value, a unique concept, or highly efficient service within this price range, you could attract a broad customer base.
- Challenge: It's also the most saturated segment. Entering here means facing significant competition. You'll need a strong unique selling proposition (USP) to stand out, and margins might be tighter, requiring high volume to be profitable.
-
Explore the "Moderate" and "Expensive" Segments (28.6% each):
- Opportunity: These segments represent a substantial portion of the market. They could offer a good balance between customer volume and potentially better profit margins than "Inexpensive" options.
- Challenge: There's still considerable competition.
- Moderate: Focus on a strong value proposition – good quality food, pleasant atmosphere, and reliable service at a reasonable price point. This segment often appeals to a wide demographic.
- Expensive: If aiming for this, your restaurant must deliver a premium experience, including high-quality ingredients, unique ambiance, excellent service, and potentially a specialized cuisine to justify the price. Differentiation and a clear target audience are crucial.
-
Weigh the "Very Expensive" Niche (7.1%):
- Opportunity: This is the least competitive segment based on numbers. If the local demographics include an affluent population that is currently underserved by high-end dining, there could be an opportunity for a truly exclusive and luxurious establishment.
- Challenge: It's a highly niche market. Success here demands exceptional quality, impeccable service, and a truly unique or prestigious dining experience. The potential customer base is smaller, and initial investment and operational costs are likely much higher. This path is high-risk, high-reward and requires thorough understanding of the specific high-end demand.
Overall Strategic Advice:
- Identify a Gap, Not Just a Price Point: While the chart shows price distribution, it doesn't reveal what kind of "Inexpensive" or "Expensive" restaurants exist. Are there specific cuisines or dining experiences missing within each price category?
- Differentiation is Key: Regardless of the price level you choose, simply adding another restaurant to an already competitive market won't guarantee success. What makes your concept unique?
- Complementary Research: This chart is a great starting point. Combine this information with further research into local demographics (income levels, age groups), existing cuisine types, traffic patterns, and community preferences to make a well-informed decision.
Competition Ratings
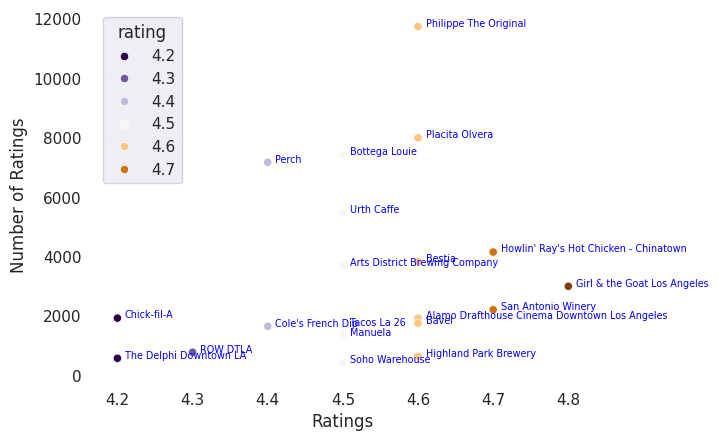
This scatterplot effectively visualizes the landscape of restaurant ratings in the Region of Influence (ROI), showing both the average rating and the sheer volume of customer feedback for each establishment.
Summary of the Chart:
The chart displays various restaurants in the ROI, plotting their average "Ratings" on the X-axis (ranging from 4.2 to 4.8) against the "Number of Ratings" received on the Y-axis (up to 12,000). The color of each point also redundantly indicates the average rating, from dark purple for 4.2 to dark orange for 4.7.
Here are the key observations:
- Overall Rating Range: Restaurants in this ROI generally receive good to excellent ratings, predominantly falling between 4.2 and 4.8. There are no restaurants with ratings below 4.2 depicted.
- Popularity vs. Rating:
- High Volume, Good Ratings: Some restaurants achieve a very high number of ratings while maintaining a strong average rating. For example, Philippe The Original leads with over 11,000 ratings and a 4.6 average. Placita Olvera (approx. 8,000 ratings, 4.6), Bottega Louie (approx. 7,500 ratings, 4.6), and Perch (approx. 7,200 ratings, 4.4) also demonstrate high popularity alongside good customer satisfaction.
- High Ratings, Moderate Volume: The highest-rated restaurants (4.7-4.8) do not necessarily have the highest number of overall ratings. Girl & the Goat Los Angeles stands out with the highest rating at 4.8, accumulated from around 3,000 ratings. Similarly, Howlin' Ray's Hot Chicken - Chinatown, Bestia, and San Antonio Winery achieve 4.7 ratings with 2,200 to 4,300 ratings. This suggests these establishments might offer a more niche or premium experience that generates extremely high satisfaction from their customer base, even if that base is not as massive as the highest-volume spots.
- Lower Ratings, Lower Volume: Restaurants with the lowest ratings on the chart, such as Chick-fil-A (4.2 rating, ~1,900 ratings) and The Delphi Downtown LA (4.2 rating, ~800 ratings), also tend to have a lower number of total ratings. This might indicate newer establishments, less consistent service, or simply a smaller, less engaged customer base compared to the giants.
- No Direct Correlation: There isn't a clear direct correlation where higher ratings always mean more ratings or vice versa. Instead, there appears to be a segment of restaurants that master high volume with solid ratings (4.4-4.6), and another segment that excels at exceptional ratings (4.7-4.8) with a respectable but not record-breaking volume of feedback.
Information Source for a New Restaurant (Customer Service Target Ratings):
For a new restaurant looking to establish itself in this ROI, the chart provides valuable insights into what level of customer service (reflected in ratings) to target, and what might be the implications for different strategies:
-
For Broad Appeal & High Customer Volume (e.g., potentially mid-range pricing, everyday dining):
- Target Rating: 4.4 to 4.6. This range represents a sweet spot for popular establishments in the ROI. Restaurants like Philippe The Original, Placita Olvera, and Bottega Louie achieve high numbers of ratings within this band. This suggests that consistently good service, reliable quality, and a generally positive customer experience are crucial for attracting and satisfying a large customer base. If your restaurant aims for a wide demographic and high foot traffic, prioritizing consistent and satisfactory service to achieve a 4.4-4.6 rating should be your primary goal. This often aligns with a "good value for money" perception.
-
For a Premium or Niche Experience (e.g., potentially higher pricing, specialty dining):
- Target Rating: 4.7 to 4.8. If your restaurant intends to offer a truly exceptional or unique dining experience that might command a higher price point or cater to a more discerning clientele, aiming for the top-tier ratings is essential. Restaurants like Girl & the Goat Los Angeles and Howlin' Ray's Hot Chicken demonstrate that achieving a 4.7-4.8 rating is possible in this area. This requires meticulous attention to detail, personalized and outstanding service, and an unforgettable overall experience. While you might not immediately attract the absolute highest volume of ratings, a high satisfaction score from a dedicated customer base can foster strong word-of-mouth and a premium brand image.
-
Minimum Acceptable Rating:
- Do not target below 4.4. The restaurants at the lower end of the rating spectrum (4.2-4.3) generally have a lower number of ratings, which could indicate less popularity or struggles with consistent customer satisfaction. To build a strong reputation in the ROI, a new restaurant should aim to significantly surpass this baseline and establish a clearly positive perception from the outset.
In essence, decide whether your new restaurant will compete on volume and consistent satisfaction (targeting 4.4-4.6) or premium experience and exceptional satisfaction (targeting 4.7-4.8). Each strategy has successful examples in this ROI, but consistent, high-quality customer service is paramount regardless of the chosen approach.
Popular restaurants near the site, sorted by count of user ratings
| Name | Rating | Count |
|---|---|---|
| Philippe The Original | 4.60 | 11739 |
| Placita Olvera | 4.60 | 7994 |
| Bottega Louie | 4.50 | 7430 |
| Perch | 4.40 | 7170 |
| Urth Caffe | 4.50 | 5473 |
| Howlin' Ray's Hot Chicken - Chinatown | 4.70 | 4154 |
| Bestia | 4.60 | 3826 |
| Arts District Brewing Company | 4.50 | 3681 |
| Girl & the Goat Los Angeles | 4.80 | 3004 |
| San Antonio Winery | 4.70 | 2215 |
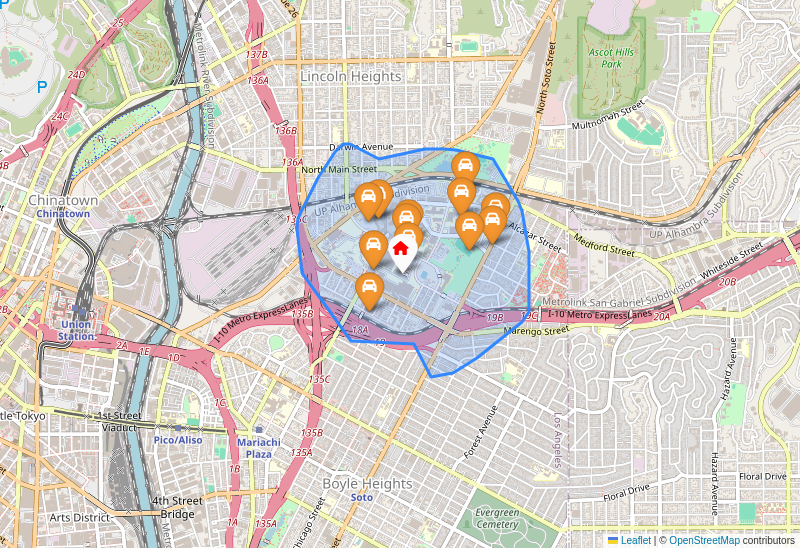
Competition Proximity
🔵 Blue - Restaurants | 🟠 Orange - Fast Food
Only businesses within a 3 mile radial distance from site are plotted
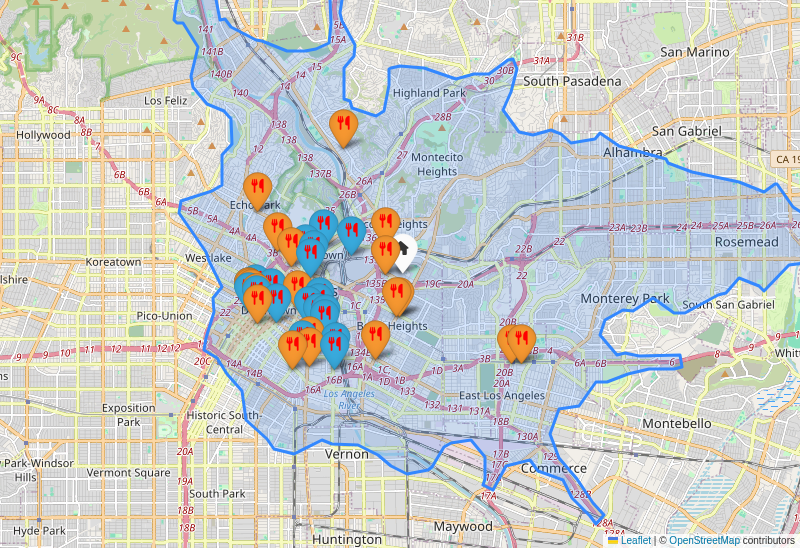
This map provides a valuable overview of the existing food service landscape in the designated area (outlined in blue), particularly around the potential new food service location (indicated by the white pointer).
Interpretation of Existing Competition:
- High Density and Saturation: The area, especially around the white pointer, is characterized by a very high density of both fast food (orange icons) and full-service restaurants (blue icons). This indicates a highly saturated and competitive market.
- Mix of Offerings: There's a significant presence of both fast food and sit-down dining options in close proximity to the proposed new location. This suggests a diverse customer base with varying needs for speed, price, and dining experience.
- Clustering: Restaurants and fast-food establishments often appear in clusters, implying popular commercial zones or high foot/vehicle traffic areas where multiple dining options can thrive. The proposed location is situated right within one of these dense clusters.
- Geographic Distribution: While the central area around the white pointer is very dense, some parts of the blue-outlined region (e.g., further north towards Highland Park, or parts of Montecito Heights, and the eastern edge towards Monterey Park/Rosemead) appear to have fewer dining options. However, the proposed location is not in one of these less-served areas.
Guidance for the New Restaurateur:
Given the highly competitive environment, a new food service location in this area faces significant challenges. Here's how to navigate the existing landscape:
-
Differentiation is Paramount:
- Unique Concept/Cuisine: Avoid replicating what's already abundant. Identify a gap in the market. Is there a demand for a specific ethnic cuisine not well-represented? A unique fusion concept? A particular dietary focus (e.g., vegan, gluten-free, organic)?
- Niche Market: Instead of trying to appeal to everyone, target a specific demographic or culinary preference that is underserved or willing to pay a premium for a specialized offering.
- Experience: Can you offer a unique dining experience, ambiance, or service level that stands out from the crowd? This could be a themed restaurant, an exceptional patio, live entertainment, or unparalleled customer service.
-
Strong Value Proposition:
- Quality: With so many options, quality will be a key differentiator. Your food must consistently be excellent, using fresh ingredients and skilled preparation.
- Price vs. Value: If you aim for a similar price point to existing establishments, your perceived value (quality, portion size, experience) must be superior. If you're higher priced, the justification (premium ingredients, unique experience, ambiance) must be clear.
- Efficiency (for fast food/fast casual): If competing with fast food, speed of service, consistency, and convenience will be crucial without compromising quality.
-
Target Market Identification:
- Thoroughly research the local demographics. Are there offices nearby (lunch crowd)? Residential areas (dinner, family meals)? Students? Tourists? Understanding who your potential customers are will help tailor your menu, pricing, and marketing.
- Consider the daily rhythm: Does the area have strong breakfast, lunch, or dinner traffic? Or is it more geared towards late-night dining?
-
Effective Marketing and Visibility:
- Stand Out Visually: Ensure your storefront, signage, and interior design are attractive and inviting, drawing attention away from the numerous competitors.
- Local Engagement: Become an active part of the local community. Offer promotions, partner with local businesses, or participate in local events.
- Online Presence: A strong online presence (website, social media, online ordering platforms, positive reviews) is essential to capture customers researching dining options.
-
Operational Excellence:
- In a saturated market, every detail matters. Efficient kitchen operations, minimal waste, well-trained and friendly staff, and consistent food quality are non-negotiable for long-term success.
In summary, a new food service location at the proposed spot will be entering a fiercely competitive arena. Success will hinge on a compelling, differentiated concept, superior quality and value, precise target marketing, effective visibility, and flawless execution. Simply offering "another restaurant" will likely lead to a struggle for market share.
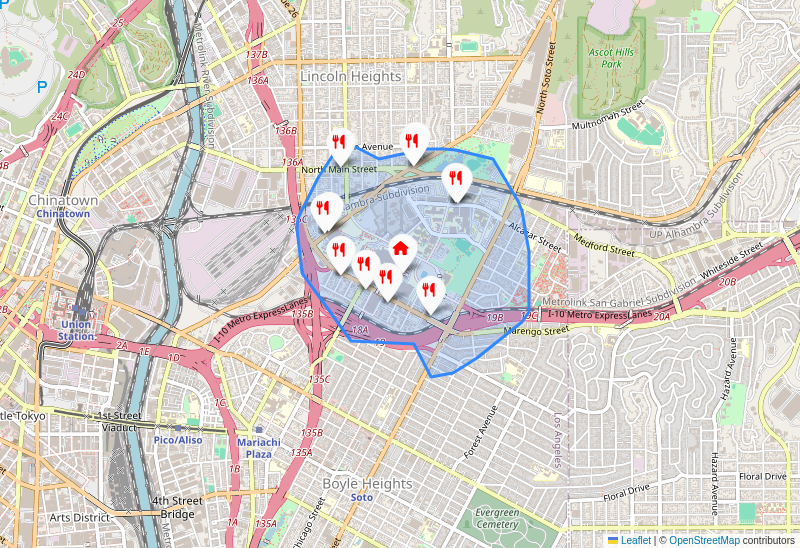
🍔 Fast Food within 15 minutes walking distance from the site
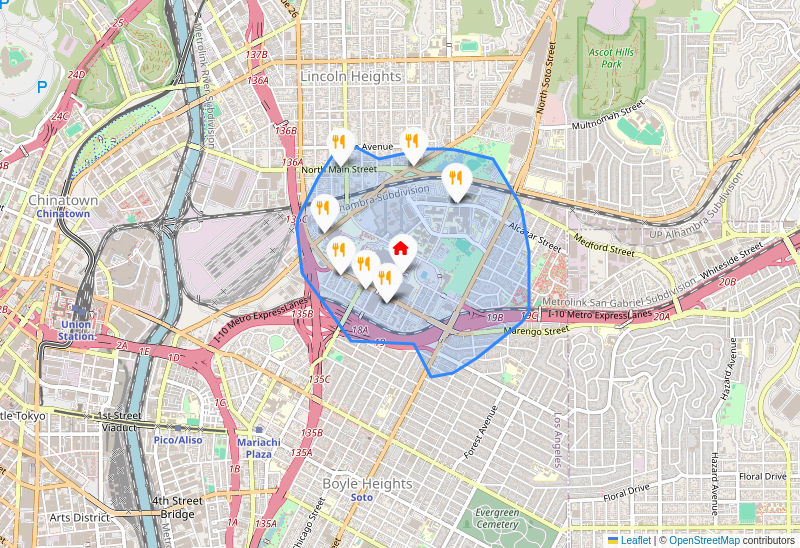
🍽️ Restaurants within 15 minutes walking distance from the site
 9
Fast Food near Site
11
Restaurants near Site
9
Fast Food near Site
11
Restaurants near Site
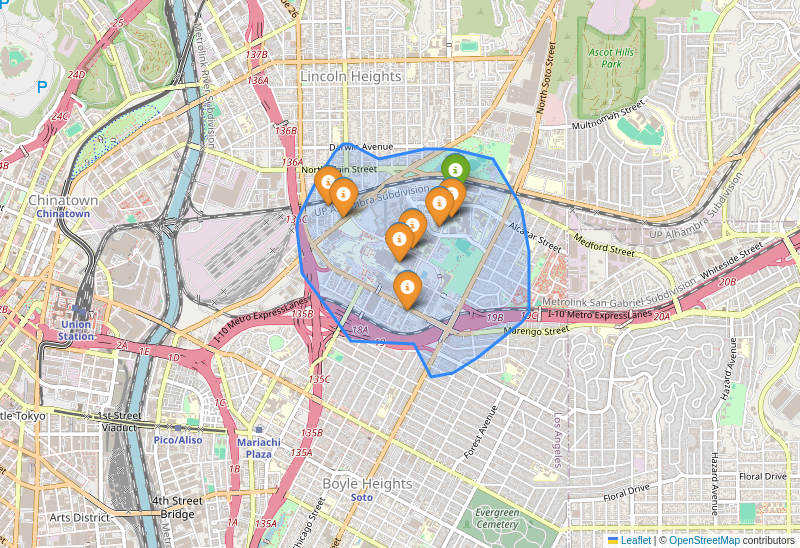
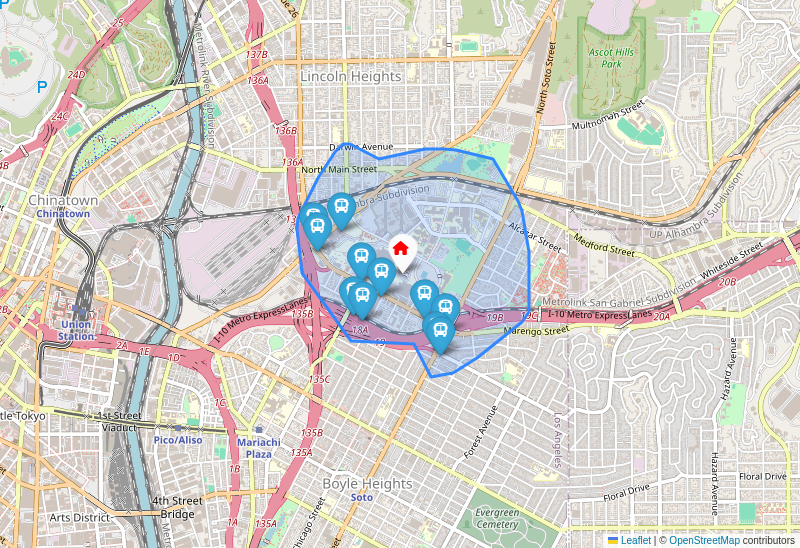
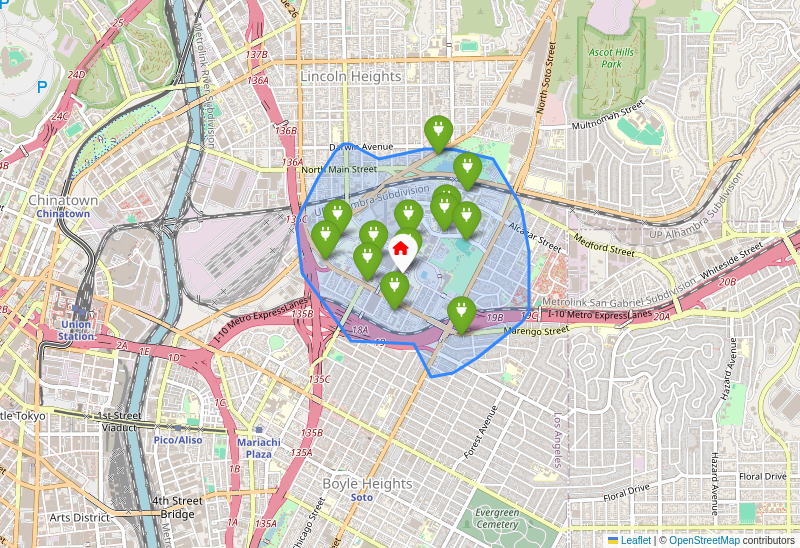
What's Nearby
🟢 Green - Hotels/Motels | 🔵 Blue - Community/Convention center/Apartments | 🟠 Orange - Educational Institution
Amenities
Accessibility (15 minutes walking distance from the site)
Travel Times (approximately 5 miles in each direction)
| Time (minutes) | Direction | Flow |
|---|---|---|
| 20 | North | From-Site |
| 19 | South | From-Site |
| 11 | East | From-Site |
| 17 | West | From-Site |
| 19 | North | To-Site |
| 20 | South | To-Site |
| 11 | East | To-Site |
| 16 | West | To-Site |
This bar chart illustrates the average travel times in minutes to and from a potential new restaurant site across four cardinal directions: West, East, South, and North. The distance traveled in each direction is approximately 5 miles.
Summary of the Chart:
- Fastest Accessibility (East): The most accessible direction is the East, with travel times of approximately 11 minutes both To-Site and From-Site. For a 5-mile distance, this indicates relatively light traffic conditions, with an average speed of about 27 mph.
- Slowest Accessibility (North & South): The North and South directions are the least accessible, showing the longest travel times.
- From the North, it takes 20 minutes From-Site and 19 minutes To-Site.
- From the South, it takes 19 minutes From-Site and 20 minutes To-Site.
- For a 5-mile distance, these times suggest significant traffic congestion or less direct routes, with an average speed of about 15-16 mph.
- Moderate Accessibility (West): The West direction falls in between, with travel times of 17 minutes From-Site and 16 minutes To-Site. This indicates moderate traffic conditions, with an average speed of about 18-19 mph.
- Symmetry of Travel: In general, the travel times To-Site and From-Site within each direction are very similar, suggesting consistent traffic patterns regardless of whether one is arriving or departing.
Impact on Restaurant Accessibility:
These travel times significantly impact the restaurant's accessibility and its potential customer base:
- Uneven Geographic Reach: The restaurant's effective "drive-time radius" is not uniform. While it's relatively quick to reach from the East (11 minutes), it's a much longer and likely more frustrating drive from the North, South, and even West, despite being the same 5-mile linear distance.
- Customer Perception of Convenience: Customers often prioritize convenience. A 20-minute drive for just 5 miles (averaging 15 mph) is likely to be perceived as inconvenient and a deterrent, especially during peak dining hours. This implies heavy traffic, many stops, or indirect routes, which can be frustrating.
- Reduced Frequency of Visits: Areas with longer travel times (North, South) are less likely to generate frequent, spontaneous visits. Customers from these directions might only consider the restaurant for special occasions or when they have ample time.
- Competitive Disadvantage: If competing restaurants are located in directions with easier access or offer similar quality closer to these less accessible areas, this site will be at a disadvantage.
- Target Market Concentration: The natural customer base will likely be concentrated in the East, and to a lesser extent, the West, due to the ease of access.
Strategies to Target Customer Base Based on This Information:
The restaurant needs a differentiated strategy based on the varied accessibility:
-
Leverage the East (Highly Accessible):
- Intensive Marketing: Focus strong marketing efforts (local ads, social media targeting, flyers) on residential and business areas to the East.
- Promotions for Regulars: Offer loyalty programs or frequent diner incentives to encourage repeat visits from this easily accessible customer segment.
- Messaging: Emphasize the "quick and easy drive," "convenient location," or "just minutes away" for customers coming from the East.
-
Mitigate Challenges for North & South (Least Accessible):
- Robust Delivery & Takeout Service: This is critical. Since customers are less likely to drive, the restaurant should heavily invest in a reliable and efficient delivery service targeting these directions. Offer online ordering and promotions specifically for delivery/takeout from these areas.
- "Worth the Trip" Messaging: For dine-in customers, the restaurant must offer a unique, compelling experience or exceptional food quality that justifies the longer, more challenging drive. Emphasize unique selling propositions (USPs) like ambiance, specific cuisine, or entertainment.
- Off-Peak Incentives: If the traffic congestion is primarily during peak hours, offer incentives (e.g., early bird specials, late-night discounts, happy hour) to encourage visits during less busy travel times.
- Community Engagement: Engage with local groups, schools, or businesses in the North and South directions through catering, sponsorships, or special events to build brand awareness and loyalty, subtly encouraging visits.
-
Address the West (Moderately Accessible):
- Balanced Approach: Apply a mix of dine-in marketing and delivery/takeout options. The drive is reasonable but not ideal, so offering convenience can capture those who might otherwise choose closer alternatives.
- Highlight Parking/Ease of Arrival: Since the drive is moderate, make sure the destination experience is seamless: ample, easy-to-find parking, and clear signage to avoid any further frustration upon arrival.
-
General Strategies for All Directions:
- Strong Online Presence: An excellent website, active social media, and positive online reviews are crucial for all, helping to draw customers even from further distances if the offering is compelling.
- Clear Directions & GPS Integration: Ensure the restaurant's location is accurately mapped on all major GPS services (Google Maps, Apple Maps, Waze) with clear instructions on the best routes, especially from congested areas.
- Strategic Signage: If possible, place strategic signage along main routes leading to the restaurant, particularly where congestion might start, to remind drivers of the restaurant's presence and desirability.
By understanding these travel dynamics, the restaurant can strategically allocate its marketing budget, service offerings, and operational focus to maximize its reach and profitability from all directions.
Real Estate
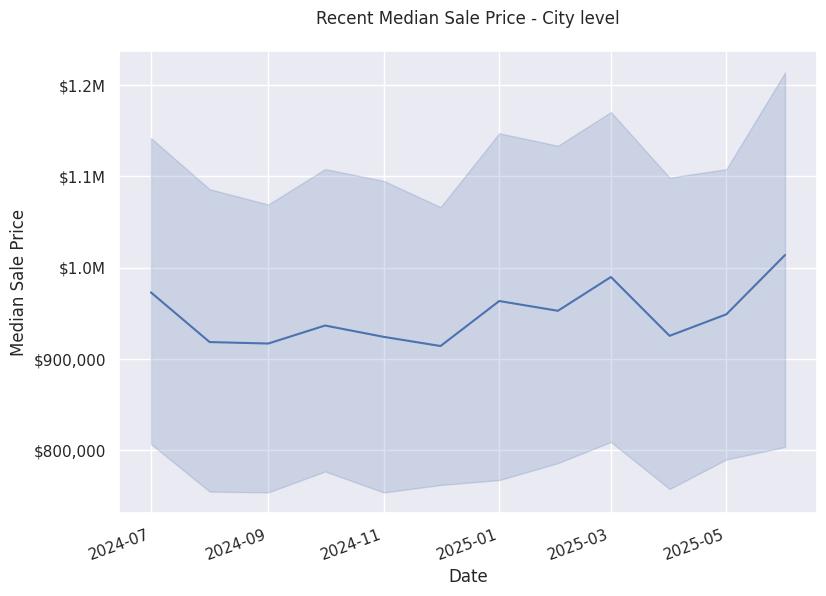
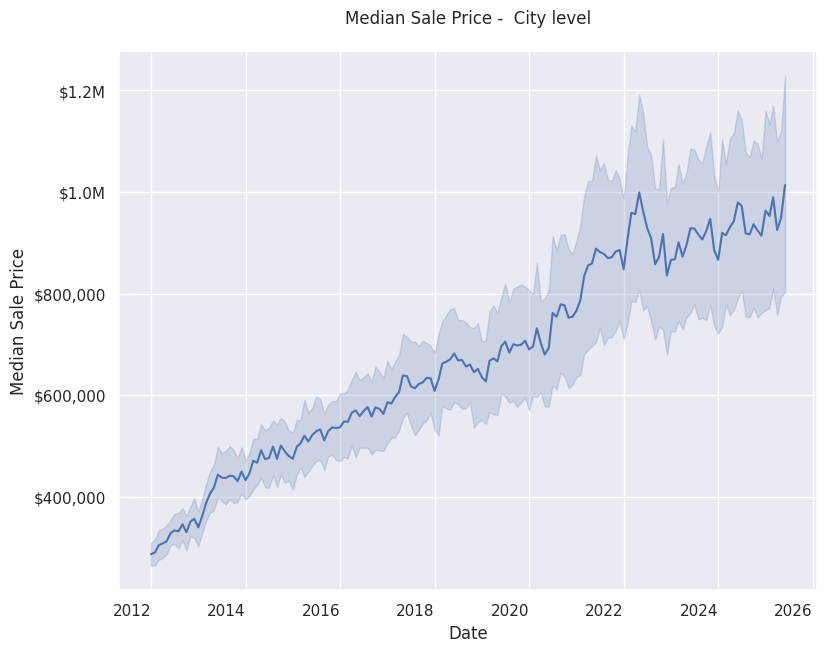
This image displays a line chart titled "Median Sale Price - City level," illustrating the trend of median real estate sale prices in a city over time.
Description of the Chart:
- Type: It's a time-series line chart with a shaded confidence interval or range.
- X-axis (Date): Represents time, spanning from early 2012 to late 2025 or early 2026, with major ticks every two years.
- Y-axis (Median Sale Price): Shows the median sale price of properties, ranging from just below $300,000 to over $1,200,000, marked with increments of $200,000 (e.g., $400k, $600k, $1.0M).
- Line: The solid blue line plots the median sale price at different points in time.
- Shaded Area: The lighter blue shaded area surrounding the line indicates the variability or a confidence interval around the median sale price. It suggests that while the median follows the blue line, there's a range within which the actual median could fall, or it represents the typical fluctuation around the median. The width of this band appears to increase over time, suggesting greater absolute variability as prices rise.
Summary and Observed Trends:
The chart summarizes a significant and consistent upward trend in median real estate sale prices at the city level over more than a decade.
Key Trends:
- Strong Long-Term Appreciation: The most prominent trend is the substantial increase in median sale prices. Starting from approximately $300,000 in early 2012, the median price has surged to hover around $950,000 to $1,000,000 by late 2025, effectively more than tripling over the period.
- Accelerated Growth in Recent Years: While there was steady growth from 2012 to around 2017 (e.g., from $300k to about $600k), the rate of increase appears to have accelerated significantly from 2018 through 2022, where the price jumped from roughly $600,000 to over $1,000,000.
- Increased Volatility and Plateauing (Post-2022): In the most recent period, particularly from late 2022 to the projected data in 2025, the median sale price shows more pronounced short-term fluctuations, and while still generally high, the rapid upward trajectory appears to have plateaued somewhat, hovering between $900,000 and $1,000,000. The shaded area also widens considerably, indicating greater variability in prices.
- Overall Growth: Despite short-term fluctuations, the overall trend clearly indicates a bullish real estate market with sustained growth in property values over the long term.
Impact on Someone Who Wants to Purchase a Property to Start a Restaurant:
The observed trends have several significant impacts on a prospective restaurant owner looking to purchase property:
- Massively Increased Capital Investment: The most direct impact is the significantly higher cost of acquisition. A property that might have been affordable in 2012 or even 2016 is now substantially more expensive. This means the restaurant owner will need significantly more capital upfront, whether through personal equity or a larger loan.
- Higher Financing Costs: A higher purchase price translates to a larger mortgage principal. Even with favorable interest rates (which are not guaranteed), monthly mortgage payments will be substantially higher than they would have been in previous years. This directly impacts the restaurant's fixed operating costs.
- Pressure on Profit Margins: With higher property costs (mortgage, property taxes, insurance, maintenance, all often tied to property value), the restaurant will need to generate significantly more revenue to cover these increased overheads. This puts pressure on menu pricing, customer volume, and overall business strategy to maintain healthy profit margins.
- Strategic Location Choices: The high prices might push a prospective buyer away from prime, high-traffic locations (which would likely command prices even higher than the city median) towards more affordable, potentially less desirable areas. This requires a careful balance between location visibility and cost.
- Challenges for New Entrants: The high barrier to entry due to property costs makes it more challenging for new businesses or first-time restaurant owners to establish themselves without substantial financial backing.
- Long-Term Asset Value: While the initial cost is high, if the trend of appreciation continues, owning the property could be a valuable long-term asset for the restaurant owner, appreciating in value alongside the business. However, the recent plateauing and increased volatility suggest future appreciation might not be as rapid or guaranteed as in the past.
- Timing Considerations: The recent flattening/volatility in prices (2022-2025) might suggest a slightly less aggressive market compared to the peak growth years. However, prices are still at a historic high. A buyer needs to assess whether this plateau is a temporary lull before another climb, or a sign of market stabilization, and how that impacts their decision to buy now versus wait.
In essence, anyone looking to buy property for a restaurant in this city faces a significantly more expensive and financially demanding environment compared to a decade ago, requiring robust financial planning and potentially more creative strategies for location and operational efficiency.
Labor Market (Specific to Food Service Industry)
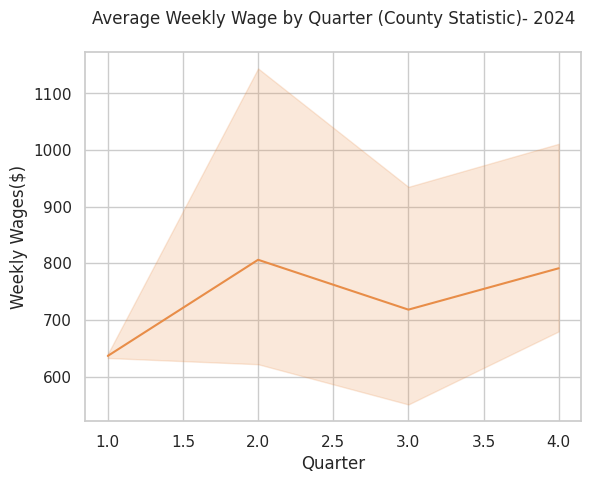
This image, showing the Average Weekly Wage by Quarter for a specific county in 2024, provides valuable insights for a food service business planning its budget. Here's how it can be used:
-
Forecasting Labor Costs:
- Identify Quarterly Averages: The solid orange line represents the average weekly wage. For example, Q1 is around $630, Q2 peaks at $800, Q3 drops to around $720, and Q4 settles around $790.
- Calculate Total Wage Expense: A food service business can multiply these average weekly wages by the number of weeks in each quarter (approx. 13) and then by the average number of employees they expect to have. This gives a baseline for quarterly payroll expenses.
- Account for Variability (Shaded Area): The shaded area around the average line represents a range or confidence interval. This is critical for robust budgeting:
- Conservative Budgeting (Worst-Case): Use the upper bound of the shaded area for each quarter to budget for potentially higher wage costs. For instance, in Q2, wages could go up to $1150/week, significantly higher than the $800 average. This prepares the business for unexpected increases in labor expenses.
- Optimistic Budgeting (Best-Case): Use the lower bound of the shaded area to see the minimum expected wage costs.
- Realistic Budgeting: The average line is a good starting point, but understanding the potential range allows for contingency planning.
-
Strategic Staffing and Scheduling:
- Anticipate Hiring Challenges/Costs: In quarters where the average weekly wage is higher (e.g., Q2 and Q4 in this graph), it might indicate higher demand for labor in the county, potentially leading to increased competition for employees or pressure to pay higher wages. A food service business should budget more for recruiting, competitive wages, or overtime in these periods.
- Optimize Staffing Levels: If wages are expected to be significantly higher in certain quarters, the business might consider optimizing staffing levels during those times, perhaps by relying more on experienced, efficient staff or cross-training employees to maximize productivity, rather than hiring many new staff at potentially inflated rates.
-
Pricing Strategy and Profit Margins:
- Adjust Menu Prices: If labor costs are projected to increase in specific quarters, the business might need to adjust menu prices strategically to maintain desired profit margins. Knowing these fluctuations in advance allows for proactive pricing changes rather than reactive ones.
- Forecast Profitability: By integrating these wage forecasts with projected revenue, a business can more accurately predict its quarterly profit margins and make informed decisions about cost controls or revenue generation efforts.
-
Cash Flow Management:
- Plan for Higher Expenses: The graph clearly shows that Q2 and Q4 are expected to have higher average weekly wages than Q1 and Q3. This means the business will need to ensure it has sufficient cash reserves to cover increased payroll expenses during those periods.
- Identify Leaner Periods: Q1 and Q3 appear to have lower average wages, potentially indicating periods of less labor cost pressure, which could free up cash for other investments or help balance out the higher cost quarters.
-
Benchmarking and Compensation:
- Set Competitive Wages: This county-level data helps a food service business understand the prevailing wage rates. When hiring or reviewing existing employee compensation, they can ensure their offerings are competitive, which is crucial for attracting and retaining talent. If their wages are consistently below the lower bound of the shaded area, they might struggle with recruitment.
Important Considerations for a Food Service Business:
- Industry-Specific Data: While this is county-level data, it's a general average. Food service wages might be different from other industries. Ideally, this would be supplemented with industry-specific wage data for better accuracy.
- Hourly vs. Salaried: This "weekly wage" data doesn't differentiate between hourly and salaried employees or the number of hours worked. The business needs to apply this average in the context of its own workforce structure.
- Benefits and Taxes: Wages are only part of the total labor cost. Businesses must also budget for employee benefits (health insurance, paid time off) and employer payroll taxes, which are usually a percentage of wages.
- Tips: In many food service roles, tips are a significant part of employee income. This graph might represent base wages, or it might include some averaged tipped income if that's how the BLS collects it. Clarity on this would be helpful.
- Correlation with Demand: While wages fluctuate, it's crucial to cross-reference this with expected customer demand and sales forecasts. Higher wages in Q2 might correlate with a busy tourist season, meaning higher revenue to offset the costs.
By carefully analyzing the average line and the range provided by the shaded area across all quarters, a food service business can develop a much more informed, proactive, and resilient budget for 2024.
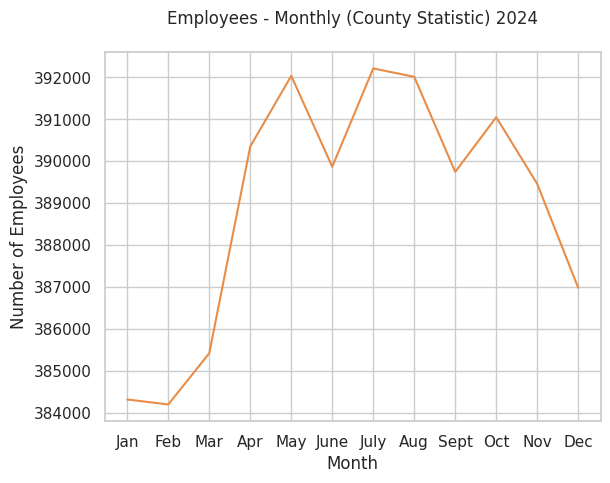
This image, showing the monthly number of employees in the restaurant industry for a specific county in 2024, can be a valuable tool for a food service business to support its staffing needs by providing insights into the broader labor market and seasonal trends.
Here's how someone can use this image:
-
Understand Overall Labor Market Demand and Supply:
- Peaks in Employment (e.g., May-July, October): These periods indicate that the restaurant industry in the county as a whole is hiring more employees. This suggests increased overall demand for labor, potentially leading to a more competitive hiring environment for individual businesses. It might be harder to find staff during these times, or wages might be driven up.
- Troughs in Employment (e.g., Jan-Feb, December): These periods show a decrease in the total number of employees in the industry. This could mean that overall demand for labor is lower, potentially making it easier to recruit new staff as other businesses might be scaling back, or there might be a larger pool of available workers.
-
Anticipate Seasonal Staffing Needs:
- Predicting Busy Seasons: The graph clearly illustrates a significant increase in employment from February to July, peaking in July, and then another smaller peak in October. This likely reflects seasonal demand, possibly due to tourism, warmer weather (outdoor dining), holidays, or local events. A food service business can infer that these are generally busier times for the industry in that county, and plan to increase their own staffing accordingly.
- Predicting Slow Seasons: Conversely, the dips in January, February, and the sharp decline into December suggest slower periods for the industry. Businesses can use this to anticipate needing fewer staff during these months, or plan for more flexible scheduling, or perhaps even offer different services (e.g., catering) to balance demand.
-
Inform Hiring Strategies and Timelines:
- Proactive Recruitment: If the county-wide employment starts to sharply increase (e.g., from March to May), a business should consider starting its recruitment efforts before the peak. This allows them to secure talent before the competition for employees becomes most intense.
- Retention Focus: During periods of high employment (e.g., summer), when many businesses are hiring, retention efforts become even more critical to prevent staff from leaving for other opportunities.
- Training Schedules: New hires might be brought on during slightly slower periods (e.g., March or September) to be fully trained and ready for the subsequent busier seasons.
-
Resource Planning and Budgeting:
- Forecasting Labor Costs: By understanding the general hiring patterns, a business can better forecast its labor budget throughout the year, anticipating higher wage expenses or increased recruitment costs during peak demand periods.
- Scheduling Optimization: The data can help optimize scheduling. During high employment months, a business might plan for more full-time staff or longer shifts, while during low employment months, they might rely more on part-time staff or adjust operating hours.
-
Benchmarking and Strategic Decisions:
- A business can compare its own staffing fluctuations against the county-wide trend. If their business is consistently understaffed during county-wide peak employment, it indicates a need to adjust their hiring strategy.
- If a business is considering expansion or significant changes, this data provides context on the availability of labor in the local market for the coming year.
In summary: While this image doesn't provide specific sales forecasts for an individual business, it offers crucial macro-level intelligence about the availability and demand for labor within the restaurant industry in that specific county throughout 2024. By understanding these broader trends, a food service business can make more informed and strategic decisions regarding recruitment, staffing levels, scheduling, and overall labor management.
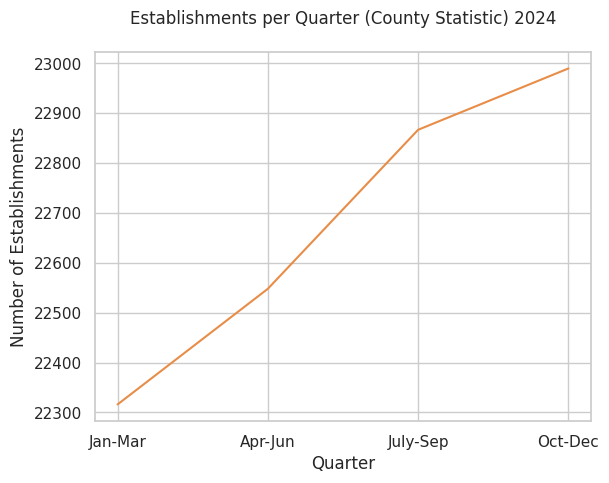
The image shows a consistent upward trend in the number of food service industry establishments in the county throughout 2024.
Here's how this provides insight into the health of the restaurant industry:
- Growth and Expansion: The most direct insight is that the industry is growing. The number of establishments increases from approximately 22,310 in the Jan-Mar quarter to nearly 22,990 by the Oct-Dec quarter. This indicates that new restaurants are opening, or existing businesses are expanding their presence, at a rate that outpaces any closures.
- Positive Market Conditions: An increasing number of establishments suggests a healthy and expanding market for food services. This implies:
- Strong Consumer Demand: People are dining out or ordering food enough to support more businesses.
- Favorable Economic Environment: The local economy might be robust, with sufficient disposable income among residents to frequent restaurants.
- Business Confidence: Entrepreneurs and investors are confident enough in the market to open new establishments, indicating a belief in potential profitability and sustainability.
- Industry Vitality: The overall upward trajectory points to a dynamic and vital restaurant sector that is not stagnant or declining. It suggests resilience and an ability to attract new ventures.
In summary, the data in the graph strongly indicates that the restaurant industry in this particular county is healthy, growing, and experiencing positive market conditions in 2024.
Incentives Available
Starting a restaurant in Los Angeles, California, can be a complex but rewarding endeavor. While direct, universal "grants" for simply opening a restaurant are rare, there are numerous incentives, support programs, and resources designed to help small businesses, including restaurants, thrive. These typically fall into several categories: financial assistance, regulatory/permitting help, business support, and workforce development.
Here's a breakdown of incentives and resources available:
I. Financial Incentives & Access to Capital
-
Small Business Administration (SBA) Loans:
- SBA 7(a) Loans: The most common type, offering flexible financing for working capital, equipment, real estate, and more. While not direct grants, they provide government guarantees to lenders, making it easier for small businesses to qualify for competitive loan terms.
- SBA 504 Loans: Provides long-term, fixed-rate financing for major fixed assets like real estate or equipment, often for expansion or modernization.
- Microloans: Smaller loans (up to $50,000) for startups and small businesses, often available through local non-profit lenders (intermediaries).
- Disaster Loans: If a declared disaster impacts your business, the SBA offers low-interest loans.
-
Community Development Financial Institutions (CDFIs):
- CDFIs are specialized financial institutions that provide financial services to low-income communities and individuals who lack access to financing from mainstream banks. Many CDFIs in LA offer small business loans with more flexible terms than traditional banks. Examples include:
- Pacific Community Ventures
- Opportunity Fund
- VEDC (now "Lendistry")
- CDFIs are specialized financial institutions that provide financial services to low-income communities and individuals who lack access to financing from mainstream banks. Many CDFIs in LA offer small business loans with more flexible terms than traditional banks. Examples include:
-
State of California Programs:
- California Competes Tax Credit: For businesses looking to grow and create jobs in California. While often for larger companies, it's worth exploring if you plan significant expansion and hiring.
- Employment Training Panel (ETP): Provides funding to employers to assist in upgrading the skills of their workers through training, often for job creation or retention.
- CALCAP Lending: The California Capital Access Program (CalCAP) encourages banks and other financial institutions to make loans to small businesses that have difficulty obtaining financing.
-
Local Utility Rebates & Incentives (LADWP, SoCalGas):
- LADWP (Los Angeles Department of Water and Power): Offers various energy efficiency programs, rebates for upgrading to energy-efficient equipment (lighting, refrigeration, HVAC), and water conservation incentives. Restaurants consume a lot of energy and water, so these can be significant savings.
- SoCalGas: Similar programs focused on natural gas efficiency.
-
Targeted Grant Programs (Less Common but Possible):
- Direct startup grants for restaurants are rare. However, grants might be available for specific purposes:
- Green/Sustainable Initiatives: Grants for adopting environmentally friendly practices (e.g., zero-waste, sustainable sourcing, electric vehicles).
- Specific Demographics: Grants for businesses owned by veterans, women, minorities, or those in economically disadvantaged areas (e.g., through federal programs or non-profits).
- COVID-19/Disaster Relief: While many immediate pandemic grants have ended, future similar programs could emerge in crises.
- Direct startup grants for restaurants are rare. However, grants might be available for specific purposes:
II. Permitting & Regulatory Assistance
-
LA City Business Portal / BIZ Portal:
- This online portal (business.lacity.org) is a crucial starting point. It helps navigate the complex permitting and licensing process for various City departments (Planning, Building & Safety, Fire, Public Health, Police, etc.). It helps identify required licenses and permits for your specific restaurant type.
- Permit Expediting: In some cases, or for businesses in specific designated areas, there may be options for expedited permit review, though this is not always universally available.
-
Los Angeles County Department of Public Health (LACDPH):
- Essential for all restaurants. While not an incentive, LACDPH offers guidance and resources to ensure compliance with food safety regulations. They can help you understand requirements before you build or renovate.
-
Business Improvement Districts (BIDs):
- LA has many BIDs throughout commercial areas. While they don't offer direct financial incentives to individual businesses, they improve the overall business environment through enhanced maintenance, security, marketing, and advocacy, which can indirectly benefit your restaurant.
III. Business Support & Guidance
-
Small Business Development Centers (SBDCs):
- Free, confidential business consulting: SBDCs (e.g., Long Beach SBDC, Pacific Coast SBDC, Pasadena SBDC) offer invaluable support on business planning, financial projections, marketing, operations, and navigating regulatory hurdles. They often have specialists experienced in the food service industry.
- Workshops & Training: Offer training on various business topics, from writing a business plan to social media marketing.
-
SCORE:
- A non-profit organization that provides free mentorship and business advice from experienced volunteer professionals. They can help with various aspects of starting and running a restaurant.
-
Women's Business Centers (WBCs) / Veteran Business Outreach Centers (VBOCs):
- Provide specialized resources, training, and counseling for women-owned and veteran-owned businesses, respectively.
-
Los Angeles City Economic and Workforce Development Department (EWDD):
- Offers a range of business services, including assistance with identifying funding sources, navigating permitting, and connecting with workforce development programs. They aim to promote economic growth and job creation within the city.
-
Chambers of Commerce:
- Local Chambers (e.g., LA Area Chamber of Commerce, Hollywood Chamber, Downtown LA Chamber) offer networking opportunities, advocacy, and resources for local businesses.
-
California Restaurant Association (CRA):
- A statewide industry association that provides advocacy, legal compliance resources, educational programs, and networking opportunities specifically for restaurants.
IV. Workforce Development Incentives
-
Workforce Investment Boards (WIBs) / America's Job Centers of California (AJCC):
- Can assist with recruiting and prescreening potential employees.
- May offer On-the-Job Training (OJT) programs, where businesses receive reimbursement for training new hires.
- Sometimes offer wage subsidies or tax credits for hiring individuals from specific target groups (e.g., long-term unemployed, veterans).
-
Tax Credits for Hiring:
- Work Opportunity Tax Credit (WOTC): A federal tax credit for employers who hire individuals from certain target groups facing barriers to employment.
- California New Employment Credit (NEC): State tax credit for hiring qualified full-time employees in designated areas.
Where to Start Your Research:
- City of Los Angeles Business Portal: Start at business.lacity.org to understand permits and licenses.
- EWDD: Visit ewdd.lacity.org for business assistance and workforce development.
- SBA.gov: Explore federal loan programs and find local SBDC offices.
- California Governor's Office of Business and Economic Development (GO-Biz): visit business.ca.gov for state-level programs.
- Your Local SBDC: Find your nearest SBDC office for free, personalized consulting.
- Los Angeles County Department of Public Health: Check their website for food facility regulations.
It's highly recommended to develop a detailed business plan and connect with an SBDC advisor early in your process. They can help you identify which specific incentives and resources are most relevant to your unique restaurant concept and situation.
Disclaimer: PICCKI offers preliminary insights into food service site suitability based on your input. It should not replace thorough due diligence, expert consultation (legal, health, zoning, etc.), or verification of all applicable regulations. You are responsible for ensuring full compliance with all local, state, and federal requirements.